5 Measuring, Mapping, and Modeling
This chapter reviews the variety of methods for assessing and measuring 6PPD and 6PPD-q among variable environmental matrices and landscapes. The discovery of a new chemical has spurred collaborations and sharing of scientific innovations to develop standard operating procedures in record time. Continued innovations and coordination among technical staff are needed to further develop and evaluate analytical methods to understand the scope and scale of the tire contaminant problem. This chapter includes a section on using desktop mapping (geographic information system [GIS]) and modeling tools to help focus reconnaissance efforts when dealing with such a widespread contaminant. In addition, this chapter provides an overview of modeling tools to help visualize potential 6PPD-q hot spots near potentially vulnerable ecosystems.
5.1 Field Methods
Science and monitoring efforts by local, state, and federal agencies and universities are in the stage of developing methods for sampling and measuring 6PPD-q. More research is needed to assess the many data gaps regarding the exposure and health impacts of TRWP, 6PPD, and 6PPD-q to human, terrestrial, and aquatic life. Defining tire contaminant leaching dynamics, fate, transport, persistence, and occurrence will help us understand exposure risks and environmental impacts. Bulk-based and single-particle–based methods are used to attempt to measure TRWP; however, the complex and variable characteristics of TRWP present analytical challenges ( Rødland et al. 2023 [SGXM45KB] Rødland, Elisabeth S., Mats Gustafsson, David Jaramillo-Vogel, et al. 2023. “Analytical Challenges and Possibilities for the Quantification of Tire-Road Wear Particles.” TrAC Trends in Analytical Chemistry 165: 117121. https://doi.org/10.1016/j.trac.2023.117121. ).
The ability to reliably measure PPDs and associated transformation products like 6PPD-q is needed to address the many data gaps. The most appropriate sampling method will depend on study objectives, the landscape, and environmental media. The matrix and available laboratories will often determine the analytical method.
The most appropriate study design will depend on the objective. There are many different types of environmental sampling study objectives, including point and nonpoint source identification, status and trends, and effectiveness monitoring. The objective will determine whether a probabilistic design or a stratified nonrandomized design is most appropriate. The intended use of the data will also guide the most effective sampling design; these include exploratory, regulatory, model building, or focusing site reconnaissance ( USEPA 2002 [AP7FTC43] USEPA. 2002. Guidance on Choosing a Sampling Design for Environmental Data Collection for Use in Developing a Quality Assurance Project Plan. EPA QA/G-5S. Office of Environmental Information. https://www.epa.gov/sites/default/files/2015-06/documents/g5s-final.pdf. ).
5.1.1 Natural Landscape Considerations
5.1.1.1 Streams/Rivers
Environmental Data Gaps
- A limited number of published studies have conducted 6PPD or 6PPD-q sampling.
- Most sampling has been along roadways and in streams or rivers.
- More sampling is needed to understand the occurrence, persistence, fate, and transport of TRWP, 6PPD, and 6PPD-q in the terrestrial and aquatic environments.
Of the species studied to date, coho salmon are the most sensitive and acutely impacted by 6PPD-q. The species resides in small streams throughout the lowlands that are often subjected to URMS. Small streams may be the most impacted by roadway runoff and TRWP, 6PPD, and 6PPD-q. Identifying the most appropriate sampling method depends on the size of the stream, accessibility, flow, mixing rates, and sampling duration. For small, well-mixed, shallow streams, a well-timed grab sample from the stream bank or a well-placed autosampler is effective. For larger rivers with higher banks, deep and fast-moving water, and difficult terrain, a cable, bridge, or boat are more appropriate for sampling. For longer-term monitoring, an autonomous stream sampling station with an autosampler triggered by rain and flow metrics is more appropriate in many instances. Autonomous moorings are another great option for larger rivers. The sampler should be aware of upstream and downstream point and nonpoint sources such as highway bridges, stormwater, or wastewater treatment discharges when choosing the best site to sample or deploy sampling equipment. The goal is to collect a sample that is representative of the whole stream; however, streams and rivers with stormwater and wastewater discharges are not always homogenous ( Shelton 1994 [7NMALZXW] Shelton, Larry R. 1994. Field Guide for Collecting and Processing Stream-Water Samples for the National Water-Quality Assessment Program. USGS Numbered Series Open-File Report Nos. 94–455. U.S. Geological Survey. ). The timing and location of exposure to TRWP, 6PPD, and 6PPD-q is poorly understood, and more research is needed.
5.1.1.2 Lakes/Ponds
The land use around a lake or pond and the discharge types to a lake or pond will determine the exposure risk to resident fish species impacted by tire contaminants. Geographic information system (GIS) desktop assessments and communication with the local managing jurisdiction will help identify areas of highest concern when determining where to sample. Lakes can provide an effective record of contamination over time, which can be accessed by collecting and processing sediment cores. Sampling biota, such as fish tissues, is another useful monitoring tool. Methods are being developed for measuring 6PPD-q in fish tissues and plasma to support this type of work. Research is needed to evaluate the presence of TRWPs in lakes and whether they continue leaching over time.
5.1.1.3 Wetlands
The impact and vulnerability of wetlands to tire contaminant exposure is currently unknown. More research is needed to understand the transport of 6PPD and 6PPD-q to wetlands and the toxicity of the contaminants to wetland inhabitants. Analysis of the effluent of wetlands to adjacent streams and estuaries is needed as well.
5.1.1.4 Estuaries
Toxics tend to accumulate in estuaries. Coho salmon are salmonids that are particularly sensitive to 6PPD-q and spend a considerable amount of time in estuaries. The juveniles spend several months to years getting ready to leave their natal watershed before they venture out to sea. Thus, the juveniles are exposed to the toxics while in the estuaries ( Carey et al. 2023 [TADJGUPJ] Carey, Andrea, Alex Gipe, William Hobbs, and Sandra O’Neill. 2023. Investigating the Source of PBDE Contaminant Exposure in Steelhead Trout within the Major Tributaries of the Nisqually River Basin. Final Contract Report Submitted to the Nisqually Indian Tribe WDFW Report Number FPT 23-02. Washington Department of Fish and Wildlife — Toxics Biological Observation System (TBiOS) and Washington Department of Ecology — Environmental Assessment Program. https://wdfw.wa.gov/sites/default/files/publications/02440/wdfw02440.pdf. ). Sampling of water, sediments, and biota in estuaries is needed to evaluate the fate and transport of tire contaminants. Like streams and rivers, the characteristics of the estuary will determine the best sampling method.
5.1.1.5 Marine
TRWPs are a major component of microplastic pollution in the marine environment ( Kole et al. 2017 [NZZMY6WC] Kole, Pieter Jan, Ansje J. Löhr, Frank G. A. J. Van Belleghem, and Ad M. J. Ragas. 2017. “Wear and Tear of Tyres: A Stealthy Source of Microplastics in the Environment.” International Journal of Environmental Research and Public Health 14 (10): 1265. https://doi.org/10.3390/ijerph14101265. Sieber et al. 2020 [LENES5UC] Sieber, Ramona, Delphine Kawecki, and Bernd Nowack. 2020. “Dynamic Probabilistic Material Flow Analysis of Rubber Release from Tires into the Environment.” Environmental Pollution 258: 113573. https://doi.org/10.1016/j.envpol.2019.113573. Boucher and Friot 2017 [KK2RJVQ6] Boucher, Julien, and Damien Friot. 2017. Primary Microplastics in the Oceans: A Global Evaluation of Sources. IUCN. ). The fate and transport of these particles and their ability to continue leaching 6PPD and 6PPD-q is unknown. More research is needed to evaluate the presence of 6PPD and 6PPD-q in the marine environment. Coastal marine environments are logistically more complex to sample and often require boats to support collections. Sediments and biota are effective methods for measuring contaminant exposure. Methods for measuring 6PPD-q in marine matrices are being evaluated.
5.1.2 Built Landscape Considerations
5.1.2.1 Drinking Water
Data Gaps in Water and Wastewater Treatment
- Minimal studies have been published regarding the efficacy of current drinking water, wastewater, and stormwater filtration technologies.
- More sampling is needed to determine whether 6PPD and 6PPD-q are properly mitigated with current technology or new treatment technologies are needed.
Human exposure to 6PPD-q has been documented by biomonitoring studies (see Section 2.5). However, the routes of exposure are still unknown. The possibility of exposure through drinking water remains a data gap. To help close the data gaps related to 6PPD and 6PPD-q in drinking water, Table 5-1 recommends locations and provides the rationale for collecting and analyzing samples for these chemicals.
Table 5-1. Recommendations for measuring 6PPD and 6PPD-q in drinking water supply systems
| Description | Recommended Sample Collection Location(s) | Rationale for Sample Collection and Analysis |
| Source Water (Rivers, Streams, Lakes, Reservoirs, Springs, Groundwater) |
|
|
| Treatment Plant (DWTP) |
|
|
| End Use |
|
|
5.1.2.2 Wastewater
WWTP receive wastewater from sanitary sewers or combined sewer systems. The type of sewer system depends on geographic location, local management guidance, and age of infrastructure. Each type of system has pros and cons. Some municipal and industrial stormwater systems discharge to WWTP. A study conducted in Toronto, Canada, detected 6PPD-q in the influent and effluent of a municipal WWTP ( Johannessen and Metcalfe 2022 [6AEMVTD8] Johannessen, Cassandra, and Chris D. Metcalfe. 2022. “The Occurrence of Tire Wear Compounds and Their Transformation Products in Municipal Wastewater and Drinking Water Treatment Plants.” Environmental Monitoring and Assessment 194 (10): 731. https://doi.org/10.1007/s10661-022-10450-9. ). Many transportation operation centers and car-washing sites collect their gray water and send it to WWTP. More research is needed to measure how effectively WWTP remove CEC, including newly discovered organic contaminants like 6PPD-q. Sampling methods will depend on the study goal and available resources. Choosing between autosamplers and grab samples will partially depend on the residence time of the influent prior to discharge ( McHugh 2023 [ZITFDETV] McHugh, Chris. 2023. Wastewater Sampling. LSASDPROC-306-R6 042223. Region 4 U.S. Environmental Protection Agency Laboratory Services & Applied Science Division. https://www.epa.gov/sites/default/files/2017-07/documents/wastewater_sampling306_af.r4.pdf. ).
5.1.2.3 Hatcheries
Water Quality of Hatcheries
- Some larger hatcheries have developed filtration systems to protect salmon and trout populations from contaminants.
- Do these filtration methods remove 6PPD and 6PPD-q?
- More studies are needed to determine whether filtration removes 6PPD-q and whether hatcheries can act as refugia from urban pollution.
- Smaller tribal hatcheries do not have the same institutional support as state and federal hatcheries.
- Hatcheries near urban areas are likely to be more vulnerable to 6PPD-q exposure, and sampling is needed to detect 6PPD-q toxicity.
The initial coho salmon mass mortality events were observed in a fish hatchery in Washington State. The hatchery used diverted stream water that ran through a moderately urbanized area. Unexplained mass die offs would occur among coho salmon, but not other salmonids. WA Ecology conducted a three-year ecoforensic investigation and determined that the mortality events occurred during or after storm events ( Kendra and Willms 1990 [BQ4XP54V] Kendra, Will, and Roger Willms. 1990. Recurrent Coho Salmon Mortality at Maritime Heritage Fish Hatchery, Bellingham: A Synthesis of Data Collected from 1987–1989. Washington State Department of Ecology, Environmental Services Program, Surface Water Investigations Section. https://apps.ecology.wa.gov/publications/documents/90e54.pdf. ). At that time, the analytical ability to pinpoint the contaminant causing the mortality had not yet been established. The hatchery switched from using stream water to well water, and the URMS events stopped. Any hatcheries that use creek or river water that are impacted by urbanization or transportation runoff are at risk of exposing sensitive species to tire contaminants. There may be a need to sample the influent of hatcheries that observe URMS occurrences or learn from the effectiveness of their filtration systems.
Hatcheries have been proposed as a refuge for salmon and trout populations that are impacted by urbanization. For example, Elwha hatcheries on the Olympic Peninsula in Washington provided a refuge after the Elwha River dam was removed and built-up sediment smothered spawning grounds. Eventually the sediment was transported out of the river, but the hatcheries helped sustain the population in the interim.
In the case of 6PPD and 6PPD-q, the hatcheries often have outdated infrastructure that may need to be retrofitted to control toxic exposures. Studies that coordinate fish population trends and 6PPD-q are needed to understand the impact on the populations at each life history stage.
5.1.3 Stormwater Considerations
Stormwater Management Efficacy
- Stormwater management is customized to land uses.
- Standardized methods are needed to identify effective stormwater management practices to protect aquatic life from 6PPD-q.
Stormwater management technologies can be designed to mimic natural filtration processes to capture TRWP and bind pollutants from roadways ( McIntyre et al. 2023 [F7NAIVJ4] McIntyre, Jenifer, Julann Spromberg, James Cameron, John P. Incardona, Jay W. Davis, and Nathaniel L. Scholz. 2023. “Bioretention Filtration Prevents Acute Mortality and Reduces Chronic Toxicity for Early Life Stage Coho Salmon (Oncorhynchus kisutch) Episodically Exposed to Urban Stormwater Runoff.” Science of the Total Environment 902 (December): 165759. https://doi.org/10.1016/j.scitotenv.2023.165759. Rodgers et al. 2023 [LZXSW5WM] Rodgers, Timothy F. M., Yanru Wang, Cassandra Humes, et al. 2023. “Bioretention Cells Provide a 10-Fold Reduction in 6PPD-Quinone Mass Loadings to Receiving Waters: Evidence from a Field Experiment and Modeling.” Environmental Science & Technology Letters, ahead of print, June 16. https://doi.org/10.1021/acs.estlett.3c00203. Spromberg et al. 2016 [GI97QYN4] Spromberg, Julann A., David H. Baldwin, Steven E. Damm, et al. 2016. “Coho Salmon Spawner Mortality in Western US Urban Watersheds: Bioinfiltration Prevents Lethal Storm Water Impacts.” Journal of Applied Ecology 53 (2): 398–407. https://doi.org/https://doi.org/10.1111/1365-2664.12534. McIntyre et al. 2014 [G79YZJGX] McIntyre, J. K., J. W. Davis, J. P. Incardona, John D. Stark, B. F. Anulacion, and N. L. Scholz. 2014. “Zebrafish and Clean Water Technology: Assessing Soil Bioretention as a Protective Treatment for Toxic Urban Runoff.” Science of the Total Environment 500: 173–80. https://doi.org/10.1016/j.scitotenv.2014.08.066. ). Customized treatment trains that employ multiple methods to reduce and control TRWPs and other contaminants is another potential effective strategy. Further research is needed to study the effectiveness of new and existing stormwater control devices and features.
The conveyance and presence or absence of SCMs will determine the discharge of 6PPD-q to potentially vulnerable aquatic habitats (see also Section 6.3.3). Inventories of these discharge outfalls and the types of conveyance and stormwater control devices will help identify areas to conduct pollution identification and correction studies.
Tire-derived contaminants are washed into waterbodies during storm events, which lead to temporary peaks in 6PPD-q concentrations ( Johannessen et al. 2022 [E9K7U5U3] Johannessen, Cassandra, Paul Helm, Brent Lashuk, Viviane Yargeau, and Chris D. Metcalfe. 2022. “The Tire Wear Compounds 6PPD-Quinone and 1,3-Diphenylguanidine in an Urban Watershed.” Archives of Environmental Contamination and Toxicology 82 (2): 171–79. https://doi.org/10.1007/s00244-021-00878-4. ). Single time-point grab samples may not represent an ecologically relevant concentration due to 6PPD-q mobility through the aquatic environment. In larger rivers and watersheds, peak concentration of 6PPD-q may not be observed for many hours after peak discharge ( Johannessen et al. 2022 [E9K7U5U3] Johannessen, Cassandra, Paul Helm, Brent Lashuk, Viviane Yargeau, and Chris D. Metcalfe. 2022. “The Tire Wear Compounds 6PPD-Quinone and 1,3-Diphenylguanidine in an Urban Watershed.” Archives of Environmental Contamination and Toxicology 82 (2): 171–79. https://doi.org/10.1007/s00244-021-00878-4. ). In smaller tributaries with high amounts of impervious surfaces that impair water quality, referred to as urban stream syndrome ( Walsh et al. 2005 [CQ74T2RQ] Walsh, Christopher J., Allison H. Roy, Jack W. Feminella, Peter D. Cottingham, Peter M. Groffman, and Raymond P. Morgan. 2005. “The Urban Stream Syndrome: Current Knowledge and the Search for a Cure.” Journal of the North American Benthological Society 24 (3): 706–23. https://doi.org/10.1899/04-028.1. ), peak concentrations may occur in the first hour. The greater the percent of impervious surface within the stream catchment, the flashier the stream and the more difficult it is to capture the pollutant peak ( Gulliver et al. 2010 [7SGTZFB7] Gulliver, J. S., A. J. Erickson, and P. T. Weiss, eds. 2010. Stormwater Treatment: Assessment and Maintenance. University of Minnesota, St. Anthony Falls Laboratory. Minneapolis, MN. https://stormwaterbook.safl.umn.edu/. ).
5.1.3.1 Stormwater Effectiveness Sampling
In some cases, paired influent and effluent sampling is useful for SCM effectiveness evaluations. Paired sampling is most appropriate for SCMs with a relatively short (on the order of minutes) detention time. Alternative sampling methods are suggested for longer detention time SCMs or treatment trains (ponds, etc.), as indicated by the Technology Assessment Protocol–Ecology (TAPE). TAPE is WA Ecology’s process for evaluating and approving emerging stormwater treatment BMPs (https://www.wastormwatercenter.org/stormwater-technologies/tape/).
5.1.3.2 Selecting a Stormwater Control Measure
Stormwater Control Measure Efficacy
- There are prescribed methods for testing and approving new technologies. These methods help avoid unintended consequences and maximize the treatment co-benefits for other pollutants of concern.
- In addition, exploratory sampling is needed for existing infrastructure and will require less stringent efficacy methods. Understanding the inventory of existing conveyance and treatment are recommended first steps.
This section presents a typical stormwater effectiveness sampling protocol. When choosing an SCM to monitor be sure to get permission from the property owner and/or jurisdiction. It is also best to do the following:
- Find an SCM that is in an area that does not have a safety hazard such as steep slopes, in a roadway, or similar.
- Avoid sites affected by backwater, tidal influence, or high groundwater.
- Ensure the land use/drainage basin will produce enough pollutants of interest to evaluate the effectiveness of the measure.
Sampling equipment will require dedicated, solar, or battery power. When selecting an SCM to monitor, consider whether staff will need to carry batteries and sample bottles a long distance. It is also best to avoid sites that require confined space entry for sample collection or other routine activities.
5.1.3.2.1 SCM Information
The following information about the SCM should be recorded/documented, where applicable:
- If this is an existing SCM, how long has the system been in operation?
- If this is an existing SCM, how frequently has it needed maintenance or been maintained?
- Was the SCM sized following the regional stormwater management guidance?
- What is the design flow rate?
- What are the treatment mechanisms (high-density sludge, sand filter, membrane filter, media filter, etc.)?
- What is the size of the system (area of filter bed, number of cartridges, etc.)? For media filters, what type of media is it?
- What is the primary land use in the drainage basin?
- How big is the drainage basin?
5.1.3.3 Precipitation Monitoring
Rainfall should be measured within the drainage basin or adjacent to the monitoring equipment. Rainfall monitoring should be performed to measure and record rainfall continuously throughout the study duration ( Washington State Department of Ecology 2018 [8VMVK98Y] Washington State Department of Ecology. 2018. “Technical Guidance Manual for Evaluating Emerging Stormwater Treatment Technologies.” Washington State Department of Ecology, September. https://apps.ecology.wa.gov/publications/documents/1810038.pdf. ). Section 5.1.3.6 summarizes a typical best practice for qualifying participation events in terms of storm size, storm duration, and antecedent conditions, although one or more of these parameters can be adjusted as necessary to meet study objectives.
5.1.3.4 Flow Monitoring
The following recommendations on current best practices for treatment system flow monitoring are summarized from technical guidance from Washington State Department of Ecology ( Washington State Department of Ecology 2018 [8VMVK98Y] Washington State Department of Ecology. 2018. “Technical Guidance Manual for Evaluating Emerging Stormwater Treatment Technologies.” Washington State Department of Ecology, September. https://apps.ecology.wa.gov/publications/documents/1810038.pdf. ). It is important to continuously monitor influent, effluent, and bypass flow rates throughout the duration of each project or study.
Influent and effluent flows should be measured as close as practicable to the inlet and outlet, respectively, to ensure that the recorded depth and flow rate represent actual conditions experienced by the system. It is important to select an effluent monitoring location that avoids measuring effluent flow rates in portions of the conveyance system where this flow mixes with bypass flow.
Stormwater that goes around the treatment system should be measured in areas that represent only the water circumventing the treatment system. It is best practice to avoid bypass flow measurement in the portions of the conveyance system where bypass flow mixes with effluent (treated) flow.
Each flow measurement device should be installed in a place that is both secure and convenient to access. The equipment needs to be properly calibrated and maintained on a regular basis and should be easily accessible for the entire duration of monitoring activities.
5.1.3.5 Water Quality Sampling
Technical guidance from WA Ecology recommends collecting a minimum of 15 pairs of samples from the influent and effluent of the treatment system during separate storm events ( Washington State Department of Ecology 2018 [8VMVK98Y] Washington State Department of Ecology. 2018. “Technical Guidance Manual for Evaluating Emerging Stormwater Treatment Technologies.” Washington State Department of Ecology, September. https://apps.ecology.wa.gov/publications/documents/1810038.pdf. ). That guidance also recommends use of automated samplers for sample collection for target analytes unless that analyte requires manual grab samples (for example, NWTPH-Dx, fecal coliform, E. coli).
When choosing monitoring locations, keep in mind that insufficient mixing may cause stratification across the flow column for settleable or floating solids and the bound pollutants associated with these solids. Best practice is to gather influent and effluent samples where stormwater flow is well mixed and unaffected by pollutants that have accumulated or been stored in stagnant areas. When an automated sampler is used, the sampling locations should be located sufficiently far from the flow-monitoring apparatus to prevent skewed depth and flow measurements ( Washington State Department of Ecology 2018 [8VMVK98Y] Washington State Department of Ecology. 2018. “Technical Guidance Manual for Evaluating Emerging Stormwater Treatment Technologies.” Washington State Department of Ecology, September. https://apps.ecology.wa.gov/publications/documents/1810038.pdf. ).
Influent samples should be collected as close as possible to the treatment system inlet to ensure that the samples are representative of actual conditions. Effluent samples should be collected as close as practicable to the outlet for the treatment system to ensure collection of samples that are representative of treated water. Samples should not be collected from locations where the conveyance system and bypass flow mix ( Washington State Department of Ecology 2018 [8VMVK98Y] Washington State Department of Ecology. 2018. “Technical Guidance Manual for Evaluating Emerging Stormwater Treatment Technologies.” Washington State Department of Ecology, September. https://apps.ecology.wa.gov/publications/documents/1810038.pdf. ).
Additional national guidance for stormwater sampling is available for urban stormwater BMP performance, NPDES compliance, and industrial stormwater ( USEPA 2017 [PFTF5ZRM] USEPA. 2017. NPDES Compliance Inspection Manual Chapter 5 — Sampling. Interim Revised Version. https://www.epa.gov/sites/default/files/2017-03/documents/npdesinspect-chapter-05.pdf. USEPA 2004 [3JZH9WJS] USEPA. 2004. NPDES Compliance Inspection Manual. EPA 305-X-04-001. Office of Enforcement and Compliance Assurance. https://www.epa.gov/sites/default/files/2013-09/documents/npdesinspect_0.pdf. USEPA 2021 [HSPCRKFU] USEPA. 2021. Industrial Stormwater Monitoring and Sampling Guide. EPA 832-B-09-003. https://www.epa.gov/sites/default/files/2015-11/documents/msgp_monitoring_guide.pdf. Geosyntec Consultants and Wright Water Engineers, Inc. 2009 [BZIBLH7F] Geosyntec Consultants, and Wright Water Engineers, Inc. 2009. Urban Stormwater BMP Performance Monitoring. https://static1.squarespace.com/static/5f8dbde10268ab224c895ad7/t/604926dae8a36b0ee128f8ac/1615406817379/2009MonitoringManualSingleFile.pdf. ).
5.1.3.6 An Example of Valid Sample/Storm Event
The list below is an example of current best practice for samples and storms to be considered an Event Mean Concentration and a valid sample:
- Storm Size: ≥0.15 inches
- Antecedent dry period: 6 hours with less than 0.04 inches
- Storm duration: ≥1 hour
- Range of rainfall intensities
- Number of aliquots per sample: ≥10
- Storm coverage: aliquots should be collected over ≥75% of the first 24 hours of the hydrograph
- Sample duration: ≤36 hours
- Number of samples (paired effluent and influent when possible): 15 each
5.1.3.7 Study Duration
The duration of the sample should span at least one and one-half maintenance cycles or, for systems with more than a 2-year maintenance cycle, two wet seasons ( Washington State Department of Ecology 2018 [8VMVK98Y] Washington State Department of Ecology. 2018. “Technical Guidance Manual for Evaluating Emerging Stormwater Treatment Technologies.” Washington State Department of Ecology, September. https://apps.ecology.wa.gov/publications/documents/1810038.pdf. ).
For a storm event meeting the criteria of Section 5.1.3.6, collection of a minimum of 15 pairs of influent and effluent samples within a 36-hour period is recommended.
5.1.3.8 Maintenance Inspections and Activities
The study should include regular maintenance inspections to track and record the maintenance needs of the test system. Maintenance indicators are generally specific to the BMP, but typical indicators include an accumulation of sediment and a reduction in effluent (treated) flow rate through the system. All maintenance inspections and activities should be documented.
5.1.4 Comparison of Sampling 6PPD and 6PPD-q
Most laboratories have chosen to measure 6PPD-q because it is more stable and has a longer half-life than 6PPD. This fact has resulted in fewer studies of 6PPD (Table 5-2) relative to 6PPD-q (Table 5-3). If measurement of 6PPD is important to the study objectives, timely extraction of 6PPD after sample collection (within hours) is necessary.
| Table | Media Type | Link to PDF | Link to Executable File (Word Processor Format) |
| 5-2 | Summary of sample collection and analytical method information for studies of 6PPD | ||
| 5-3 | Summary of sample collection and analytical method information for studies of 6PPD-q |
Note: PDF versions of each table are provided for the reader to view information in a visual format that is consistent across browsers and platforms. Executable files are provided to allow readers to sort information by the column of their choice, but may appear different visually depending on the software used to view this file. Instructions on how to sort information in a document formatted for a word processor format are widely available by internet search.
The pros and cons of commonly used sampling methods for 6PPD-q in various media are presented in Table 5-4.
| Table | Media Type | Link to PDF | Link to Executable File (Word Processor Format) |
| 5-4 | Assessment of 6PPD-q sample collection methods |
Note: The PDF version of this table is provided for the reader to view information in a visual format that is consistent across browsers and platforms. The executable file is provided to allow readers to sort information by the column of their choice, but may appear different visually depending on the software used to view this file. Instructions on how to sort information in a document formatted for a word processor format are widely available by internet search.
5.1.5 Sampling 6PPD-q in Water
Capturing the peak (the highest concentration) of 6PPD-q is essential when determining the exposure impact to sensitive organisms. The sampling objectives also drive the type of sampler used so that exposure to 6PPD-q can be accurately measured over a given period and agencies can assess the risk of URMS occurrences.
Table 5-5 presents recommended approaches and materials to minimize or avoid when collecting samples for 6PPD-q in water.
Table 5-5. Sampling recommendations for 6PPD-q in water
| Category | Recommended | Minimize or Avoid |
| Pump Tubing | PTFE tubing | Silicon tubing |
| Sample Container | Amber glass bottle with PTFE-lined cap; cleaned and certified | Plastic containers |
| Sample Splitters or Funnels | Metal or PTFE | Other plastics |
| Gloves | Nitrile | |
| Sample Storage | On ice until delivered to lab for analysis |
Note: PTFE=polytetrafluoroethylene
The remainder of this section describes different ways to collect water samples for 6PPD-q.
5.1.5.1 Grab Sampling
Grab samples can be an effective sampling method when screening for 6PPD-q given its flexibility and low cost. Yet, 6PPD-q grab samples often require logistically challenging storm chasing at all hours and days of the week and can result in false nondetects when pollutant peaks are missed. Amber glass bottles are recommended to prevent 6PPD-q loss from binding and photodegradation, and polyurethane bottles can be used for short hold times (hours); samples should be transferred to glass for longer hold times ( Hu et al. 2023 [BFCN5BLS] Hu, Ximin, Haoqi (Nina) Zhao, Zhenyu Tian, Katherine T. Peter, Michael C. Dodd, and Edward P. Kolodziej. 2023. “Chemical Characteristics, Leaching, and Stability of the Ubiquitous Tire Rubber–Derived Toxicant 6PPD-Quinone.” Environmental Science: Processes & Impacts 25 (5): 901–11. https://doi.org/10.1039/D3EM00047H. ).
To date, there are no 6PPD-q–specific sampling considerations for drinking water collection. Use existing drinking water protocols and the general 6PPD-q water sampling recommendations.
5.1.5.2 Active Sampling in Water
Autosampler Considerations
- PTFE tubing and glass bottles are preferred to minimize 6PPD-q loss due to affinity to some plastics.
- If polyethylene containers are used, the sample should be transferred to amber glass bottles or extracted as soon as possible.
- Store samples on ice until transferred to the lab.
- Remotely triggered or programmed samplers are an effective method that reduce logistically challenging storm chasing.
Autosamplers are an effective active sampling method for measuring organic contaminants in stormwater, but they require an equipment investment and technical staff. Most autosamplers can be programmed to composite the samples into one jar or collect discrete, sequential samples in separate containers. The ability to trigger the autosampler to capture a water sample at the right time is an effective way to capture the pollutant peak, whereas other methods are averaging or integrative.
Special considerations for 6PPD-q autosampling include tubing and bottle-type choices. The preferred bottle type is amber glass; however, polyurethane bottles are acceptable for short periods of time based on the measured stickiness of lab and field equipment ( Hu et al. 2023 [BFCN5BLS] Hu, Ximin, Haoqi (Nina) Zhao, Zhenyu Tian, Katherine T. Peter, Michael C. Dodd, and Edward P. Kolodziej. 2023. “Chemical Characteristics, Leaching, and Stability of the Ubiquitous Tire Rubber–Derived Toxicant 6PPD-Quinone.” Environmental Science: Processes & Impacts 25 (5): 901–11. https://doi.org/10.1039/D3EM00047H. ). If polyurethane bottles are used, samples should be transferred to amber glass bottles as soon as possible. The preferred tubing is polytetrafluoroethylene (PTFE)-lined tubing, as 6PPD-q has been shown to readily adhere to other types of tubing ( Hu et al. 2023 [BFCN5BLS] Hu, Ximin, Haoqi (Nina) Zhao, Zhenyu Tian, Katherine T. Peter, Michael C. Dodd, and Edward P. Kolodziej. 2023. “Chemical Characteristics, Leaching, and Stability of the Ubiquitous Tire Rubber–Derived Toxicant 6PPD-Quinone.” Environmental Science: Processes & Impacts 25 (5): 901–11. https://doi.org/10.1039/D3EM00047H. ). Samples should be kept on ice until transported from the field to the lab for extractions.
According to Gulliver et al. ( Gulliver et al. 2010 [7SGTZFB7] Gulliver, J. S., A. J. Erickson, and P. T. Weiss, eds. 2010. Stormwater Treatment: Assessment and Maintenance. University of Minnesota, St. Anthony Falls Laboratory. Minneapolis, MN. https://stormwaterbook.safl.umn.edu/. ), “…[r]emote sampler capabilities reduce collection costs and make it possible to obtain many more samples per storm event than is possible with current manual sampling techniques.” For example, USEPA has created an in-stream remote sampling tool that uses a micropump to collect water samples ( Kahl et al. 2014 [X5ZATENS] Kahl, Michael D., Daniel L. Villeneuve, Kyle Stevens, et al. 2014. “An Inexpensive, Temporally Integrated System for Monitoring Occurrence and Biological Effects of Aquatic Contaminants in the Field: Novel System for in Situ Testing.” Environmental Toxicology and Chemistry 33 (7): 1584–95. https://doi.org/10.1002/etc.2591. ). Other groups have developed similar remote samplers (for example, Schönenberger et al. 2020 [6Q9QTYR8] Schönenberger, Urs, Michael Patrick, Simon Wullschleger, and Christian Stamm. 2020. “A Water-Level Proportional Water Sampler for Remote Areas.” Zenodo. https://zenodo.org/records/4280534. ). These types of samplers may prove more practical for stormwater monitoring needs because they cost less while offering greater flexibility on sampling location relative to traditional approaches using manual sampling.
5.1.5.3 Passive Sampling in Water
Passive Samplers
- Passive samplers provide a cost-effective method for assessing the most bioavailable dissolved form of a contaminant. Passive samplers for 6PPD-q are being evaluated.
Passive samplers have gained popularity over the last decade as an effective method for assessing the spatial and temporal occurrence of organic contaminants. The passive samplers are deployed in the field and left for days to weeks; many are relatively affordable, and some mimic the bioavailable form of contaminants. This is particularly useful for 6PPD-q that is transported during storm events and persists for only hours to days in surface water before settling to the benthic environment or being transported downstream; such contaminants are difficult to reliably measure. Preliminary investigations are underway to evaluate the efficacy of several passive samplers for quantifying 6PPD-q. To date, state and federal agencies are working to estimate sampling rates and produce standard operating procedures to support local passive sampling research.
5.1.5.4 Size Partitioning (Filtering)
Considering the affinity of 6PPD-q to stick to filters, total bulk sampling is recommended unless the study design objective is to understand the size-class partitioning or method development loss of 6PPD-q during filtration and sampling. When filters are employed to separate dissolved and total fractions, the filters should be extracted for 6PPD-q.
Passive sampler media and types are designed to sorb to different size molecules and polarities. The type of passive sampler selected should be the one most appropriate for the objective of the study. See Table 5-4 for a comparison of several passive sampler types.
5.1.6 Sampling 6PPD-q in Soil
Few studies to date have measured 6PPD-q in soils and sediments. Most studies were conducted within a laboratory setting to test how effective various biofiltration media are at removing 6PPD-q transported by roadway runoff ( McIntyre et al. 2023 [F7NAIVJ4] McIntyre, Jenifer, Julann Spromberg, James Cameron, John P. Incardona, Jay W. Davis, and Nathaniel L. Scholz. 2023. “Bioretention Filtration Prevents Acute Mortality and Reduces Chronic Toxicity for Early Life Stage Coho Salmon (Oncorhynchus kisutch) Episodically Exposed to Urban Stormwater Runoff.” Science of the Total Environment 902 (December): 165759. https://doi.org/10.1016/j.scitotenv.2023.165759. Spromberg et al. 2016 [GI97QYN4] Spromberg, Julann A., David H. Baldwin, Steven E. Damm, et al. 2016. “Coho Salmon Spawner Mortality in Western US Urban Watersheds: Bioinfiltration Prevents Lethal Storm Water Impacts.” Journal of Applied Ecology 53 (2): 398–407. https://doi.org/https://doi.org/10.1111/1365-2664.12534. ). Many data gaps exist regarding how long 6PPD and 6PPD-q persist in soils at the side of the road and whether 6PPD-q remains bound once filtered by soils.
5.1.7 Sampling 6PPD-q in Sediments
Zeng et al. ( Zeng et al. 2023 [TK5YR8WJ] Zeng, Lixi, Yi Li, Yuxin Sun, Liang-Ying Liu, Mingjie Shen, and Bibai Du. 2023. “Widespread Occurrence and Transport of p-Phenylenediamines and Their Quinones in Sediments across Urban Rivers, Estuaries, Coasts, and Deep-Sea Regions.” Environmental Science & Technology, January 31, acs.est.2c07652. https://doi.org/10.1021/acs.est.2c07652. ) conducted a survey of PPDs in riverine, estuarine, and marine sediments. 6PPD-q was observed in these waterways. Samples of the top 10 cm of sediment were collected from a research vessel using a grab sampler. Three samples were collected and mixed as a composite sample and frozen for transport to the laboratory. The samples were freeze-dried, weighed, sieved through a 1.0 mm mesh screen to remove debris and stored at −80°C until analysis. Holding times and methods are discussed further in Section 5.2: Laboratory Methods. Standard operating procedures are being developed for sediment collection and analysis, see Table 5-4 for a comparison of additional sediment collection methods. The most appropriate method and study design will depend on the study objective.
5.1.8 Sampling 6PPD-q in Organisms
5.1.8.1 Tissues and Plasma
The measurement of 6PPD and 6PPD-q in biotic materials may provide an effective measure of exposure to aquatic and terrestrial organisms, including humans. URMS occurrences can be difficult to catch given the short exposure duration period and low concentrations required to cause mortality. The ability to measure 6PPD and 6PPD-q in biota may help us understand the occurrence, exposure, sublethal, and chronic impacts to more tolerant species and whether there are any exposures though the food chain, including to humans.
5.1.8.2 Bioassays/Biomarkers
Most ambient water contains several to thousands of chemicals forming complex and dynamic mixtures in rivers and streams; this situation is challenging because many of the co-occurring chemicals have not been toxicologically tested and the way that chemicals in mixtures interact is highly challenging to predict. Therefore, bioassays can be used alone or in conjunction with 6PPD-q analysis to provide an integrated means of assessing mixtures and their dynamic behavior. Several bioassay types exist that vary in complexity and logistical demands. Depending on the goals of a monitoring event or study, careful consideration of their pros and cons is essential to produce data responsive to the question being addressed. Table 5-4 provides a set of common approaches that may be considered for research or regulatory purposes.
5.1.9 Bioassessments
Biological assessments are evaluations of the condition of waterbodies using surveys and other direct measurements of resident biological organisms (macroinvertebrates, fish, and plants). Biological assessment results are used to answer the question of whether waterbodies support survival and reproduction of desirable fish, shellfish, and other aquatic species—in other words, whether the waterbodies meet their designated aquatic life uses.
Monitoring the status and trends of water quality and habitat indicators is an important type of assessment that tracks whether overall water quality and habitat conditions are improving or degrading and is most appropriate when done on a regional scale over a long period of time (decades). Biological assessments have become a widely accepted metric of overall stream health; however, it can be a challenging metric to connect to a single contaminant over a short period of time ( Larson et al. 2019 [UMIHZC75] Larson, Chad A., Glenn Merritt, Jack Janisch, et al. 2019. “The First Statewide Stream Macroinvertebrate Bioassessment in Washington State with a Relative Risk and Attributable Risk Analysis for Multiple Stressors.” Ecological Indicators 102 (July): 175–85. https://doi.org/10.1016/j.ecolind.2019.02.032. ). For agencies or programs that rely on bioassessments, it might be advantageous to revisit past studies that used biological assessments that were unable to determine a cause of poor stream health; such instances may correlate with 6PPD-q detections or storm events. Road crossings are popular places to access streams for bioassessments, and road proximity should be considered when selecting site assessment locations. In general, reference sites should be located upstream of roads, and impact sites should be located downstream.
5.1.10 Sampling 6PPD-q in Air
Methods for monitoring particles in air have been available for decades; the first studies monitoring TRWP in air were published in the 1970s ( Johannessen et al. 2022 [YXQSYBCM] Johannessen, Cassandra, John Liggio, Xianming Zhang, Amandeep Saini, and Tom Harner. 2022. “Composition and Transformation Chemistry of Tire-Wear Derived Organic Chemicals and Implications for Air Pollution.” Atmospheric Pollution Research 13 (9): 101533. https://doi.org/10.1016/j.apr.2022.101533. ). Methods for sampling 6PPD and 6PPD-q in air are much the same.
5.1.10.1 Active Sampling in Air
Active sampling of particulate matter is commonly achieved using a quartz fiber filter or series of filters coupled with a low-, medium-, or high-volume air sampler. Most ambient air monitoring of particulates follows the Federal Reference Method for the Determination of Particulate Matter as PM10 in the Atmosphere (40 CFR, Chapter 1, part 50, Appendix M, as published in 62 Federal Register, 38753, July 18, 1997) and as PM2.5 (40 CFR, Chapter 1, part 50, Appendix L, as published in 62 Federal Register, 38714, July 18, 1997 and as amended in 64 Federal Register, 19717, April 22, 1999). Variations of these methods have been successfully used to sample TRWP, 6PPD, and 6PPD-q (for example, Zhang et al. 2022 [G77DTKD6] Zhang, Yanhao, Caihong Xu, Wenfen Zhang, et al. 2022. “p‑Phenylenediamine Antioxidants in PM2.5: The Underestimated Urban Air Pollutants.” Environmental Science & Technology 56 (11): 6914–21. https://doi.org/https://doi.org/10.1021/acs.est.1c04500. Zhang et al. 2022 [GHLGNCHV] Zhang, Ying-Jie, Ting-Ting Xu, Dong-Min Ye, Ze-Zhao Lin, Fei Wang, and Ying Guo. 2022. “Widespread N‑(1,3-Dimethylbutyl)‑N′‑phenyl‑p‑phenylenediamine Quinone in Size-Fractioned Atmospheric Particles and Dust of Different Indoor Environments.” Environmental Science & Technology Letters 9 (5): 420–25. https://doi.org/https://doi.org/10.1021/acs.estlett.2c00193. Wang et al. 2022 [TMV9VLRS] Wang, Wei, Guodong Cao, Jing Zhang, et al. 2022. “Beyond Substituted p-Phenylenediamine Antioxidants: Prevalence of Their Quinone Derivatives in PM2.5.” Environmental Science & Technology, July 14, acs.est.2c02463. https://doi.org/10.1021/acs.est.2c02463. Panko et al. 2019 [H57M387X] Panko, Julie M., Kristen M. Hitchcock, Gary W. Fuller, and David Green. 2019. “Evaluation of Tire Wear Contribution to PM2.5 in Urban Environments.” Atmosphere 10 (2): 99. https://doi.org/10.3390/atmos10020099. Panko et al. 2013 [UQNTNRM4] Panko, Julie M., Jennifer Chu, Marisa L. Kreider, and Ken M. Unice. 2013. “Measurement of Airborne Concentrations of Tire and Road Wear Particles in Urban and Rural Areas of France, Japan, and the United States.” Atmospheric Environment 72 (June): 192–99. https://doi.org/10.1016/j.atmosenv.2013.01.040. ).
Settled dust can be collected using a precleaned brush and dustbin or shovel.
5.1.10.2 Passive Sampling in Air
Passive sampling of 6PPD and 6PPD-q in air is accomplished using the same PUF-based passive air samplers (PUF-PAS) that are used to sample other airborne organic and inorganic contaminants (for example, Gaga et al. 2019 [5HHJMIKX] Gaga, Eftade O., Tom Harner, Ewa Dabek-Zlotorzynska, et al. 2019. “Polyurethane Foam (PUF) Disk Samplers for Measuring Trace Metals in Ambient Air.” Environmental Science & Technology Letters 6 (9): 545–50. https://doi.org/10.1021/acs.estlett.9b00420. Saini et al. 2020 [2B4BLHGY] Saini, Amandeep, Tom Harner, Sita Chinnadhurai, et al. 2020. “GAPS-Megacities: A New Global Platform for Investigating Persistent Organic Pollutants and Chemicals of Emerging Concern in Urban Air.” Environmental Pollution 267 (December): 115416. https://doi.org/10.1016/j.envpol.2020.115416. Rauert et al. 2018 [Q65D2KZM] Rauert, Cassandra, Jasmin K. Schuster, Anita Eng, and Tom Harner. 2018. “Global Atmospheric Concentrations of Brominated and Chlorinated Flame Retardants and Organophosphate Esters.” Environmental Science & Technology 52 (5): 2777–89. https://doi.org/10.1021/acs.est.7b06239. ). This method involves the deployment of PUF disks for anywhere from 24 hours to several months, depending on expected atmospheric concentrations. These samplers can gather samples representing the whole air mixture because they collect both gas- and particle-phase chemicals with an equivalent air sampling rate of about 4 m3/day. After the PUF disk is extracted and contaminants on the disk are quantified, air concentrations can be estimated by dividing the chemical mass in each sample by the corresponding equivalent air volume, which is calculated by multiplying the number of days that the passive samplers were exposed by the generic sampling rate of 4 m3/day. This method has been successfully used for sampling 6PPD and 6PPD-q (for example, Johannessen et al. 2022 [RYBDCBV4] Johannessen, Cassandra, Amandeep Saini, Xianming Zhang, and Tom Harner. 2022. “Air Monitoring of Tire-Derived Chemicals in Global Megacities Using Passive Samplers.” Environmental Pollution 314 (December): 120206. https://doi.org/10.1016/j.envpol.2022.120206. ).
5.2 Laboratory Methods
This section summarizes published analytical methods and laboratory approaches for the analysis of 6PPD and 6PPD-q; this is intended to provide a starting point for information about laboratory methods as of April 2024. Detection limits of the analytical methods will continue to evolve to provide relevant low-level data as toxicity thresholds are established.
Laboratory Methods
Commercial, public, and research laboratories are developing methods for the analysis of 6PPD and 6PPD-q in a range of environmental matrices and consumer products.
When selecting a laboratory, aspects to consider for data quality and reproducibility include method accreditation, detection limits, sample holding times, and quality control parameters.
Stormwater and surface water can have high turbidities and, because 6PPD and 6PPD-q sorb to organic material, it is important to use a method that provides whole-water analysis.
This document does not address methods for analyzing TRWP in the environment because in part, that is beyond the scope, and in part because quantifying the actual particles in environmental matrices poses analytical challenges. Even sampling TRWP in water is difficult because the density of TRWP changes as the particles age and sink to the sediment ( Johannessen et al. 2022 [RYBDCBV4] Johannessen, Cassandra, Amandeep Saini, Xianming Zhang, and Tom Harner. 2022. “Air Monitoring of Tire-Derived Chemicals in Global Megacities Using Passive Samplers.” Environmental Pollution 314 (December): 120206. https://doi.org/10.1016/j.envpol.2022.120206. ). Chemicals associated with tire rubber have been proposed as markers to estimate TRWP. For example, N-formyl-6-PPD, hydroxylated N-1,3- dimethylbutyl-N-phenyl quinone diamine, and 6PPD-q are potential organic markers for TRWPs in the environment, but further research is needed to confirm the relationship between TRWP and the chemicals ( Johannessen et al. 2022 [RYBDCBV4] Johannessen, Cassandra, Amandeep Saini, Xianming Zhang, and Tom Harner. 2022. “Air Monitoring of Tire-Derived Chemicals in Global Megacities Using Passive Samplers.” Environmental Pollution 314 (December): 120206. https://doi.org/10.1016/j.envpol.2022.120206. ).
5.2.1 Physicochemical Property Considerations in the Laboratory
Physicochemical properties are discussed in Section 3 and summarized in Table 3-1. Rubber laboratory materials should be avoided to prevent contamination of 6PPD or 6PPD-q.
6PPD: The main considerations for 6PPD analysis are the relatively short half-life of several hours in aqueous solution ( Johannessen et al. 2022 [RYBDCBV4] Johannessen, Cassandra, Amandeep Saini, Xianming Zhang, and Tom Harner. 2022. “Air Monitoring of Tire-Derived Chemicals in Global Megacities Using Passive Samplers.” Environmental Pollution 314 (December): 120206. https://doi.org/10.1016/j.envpol.2022.120206. ), solubility of 0.5 to 2 mg/L, and relatively high log Kow and log Koc ( DTSC 2022 [2M3Z8Z4F] DTSC. 2022. Product-Chemical Profile for Motor Vehicle Tires Containing N-(1,3-Dimethylbutyl)-N′-Phenyl-p-Phenylenediamine (6PPD) from the California Department of Toxic Substances Control (DTSC). https://dtsc.ca.gov/wp-content/uploads/sites/31/2022/05/6PPD-in-Tires-Priority-Product-Profile_FINAL-VERSION_accessible.pdf. Hiki et al. 2021 [WZF69GXC] Hiki, Kyoshiro, Kenta Asahina, Kota Kato, et al. 2021. “Acute Toxicity of a Tire Rubber–Derived Chemical, 6PPD Quinone, to Freshwater Fish and Crustacean Species.” Environmental Science & Technology Letters 8 (9): 779–84. https://doi.org/10.1021/acs.estlett.1c00453. Klöckner et al. 2020 [9B7NCVNZ] Klöckner, Philipp, Bettina Seiwert, Paul Eisentraut, Ulrike Braun, Thorsten Reemtsma, and Stephan Wagner. 2020. “Characterization of Tire and Road Wear Particles from Road Runoff Indicates Highly Dynamic Particle Properties.” Water Research 185 (October): 116262. https://doi.org/10.1016/j.watres.2020.116262. ECHA 2021 [Y79Z3ZWV] ECHA. 2021. “Substance Infocard: N-1,3-Dimethylbutyl-N’-Phenyl-p-Phenylenediamine. European Chemicals Agency (ECHA).” April 7. https://echa.europa.eu/substance-information/-/substanceinfo/100.011.222. ). If 6PPD is present in environmental water samples, there is a short window of analysis time before the compound degrades. Even though the solubility of 6PPD is greater (mg/L) than 6PPD-q (µg/L range), because of its short half-life, 6PPD is anticipated to be detected less frequently in the dissolved phase than 6PPD-q in waterways. When investigating the leaching of 6PPD directly from tire particles or TWPs, the solvent for leaching studies and approach used can influence the rate and number of tire-related compounds leached ( Foscari et al. 2023 [EHDIWG3V] Foscari, Aurelio, Natascha Schmidt, Bettina Seiwert, Dorte Herzke, Richard Sempéré, and Thorsten Reemtsma. 2023. “Leaching of Chemicals and DOC from Tire Particles under Simulated Marine Conditions.” Frontiers in Environmental Science 11 (June). https://doi.org/10.3389/fenvs.2023.1206449. Zhao et al. 2023 [ENE6F3HC] Zhao, Haoqi Nina, Ximin Hu, Zhenyu Tian, et al. 2023. “Transformation Products of Tire Rubber Antioxidant 6PPD in Heterogeneous Gas-Phase Ozonation: Identification and Environmental Occurrence.” Environmental Science & Technology 57 (14): 5621–32. https://doi.org/10.1021/acs.est.2c08690. ). The inclusion of 4-hydroxydiphenylamine (4-HDPA) and other transformation products of 6PPD in the monitoring may provide a more comprehensive view on 6PPD leaching, particularly in long-term studies.
6PPD-q: A challenging aspect for 6PPD-q analysis is the relatively high log Kow and log Koc, which cause it to partition to organic or solid materials. Materials used by the laboratories should be investigated to be sure sorption is minimized when filtering or processing samples and that laboratory carryover is minimized on equipment. 6PPD-q is observed in the aqueous phase before binding to organic or solid materials and can remain in the aqueous phase for days in tap water, laboratory stock solutions, and stormwater ( Lane et al. 2024 [Q3DSSIIU] Lane, Rachael F., Kelly L. Smalling, Paul M. Bradley, et al. 2024. “Tire-Derived Contaminants 6PPD and 6PPD-Q: Analysis, Sample Handling, and Reconnaissance of United States Stream Exposures.” Chemosphere, July 11, 142830. https://doi.org/10.1016/j.chemosphere.2024.142830. Hu et al. 2023 [BFCN5BLS] Hu, Ximin, Haoqi (Nina) Zhao, Zhenyu Tian, Katherine T. Peter, Michael C. Dodd, and Edward P. Kolodziej. 2023. “Chemical Characteristics, Leaching, and Stability of the Ubiquitous Tire Rubber–Derived Toxicant 6PPD-Quinone.” Environmental Science: Processes & Impacts 25 (5): 901–11. https://doi.org/10.1039/D3EM00047H. Hiki et al. 2021 [WZF69GXC] Hiki, Kyoshiro, Kenta Asahina, Kota Kato, et al. 2021. “Acute Toxicity of a Tire Rubber–Derived Chemical, 6PPD Quinone, to Freshwater Fish and Crustacean Species.” Environmental Science & Technology Letters 8 (9): 779–84. https://doi.org/10.1021/acs.estlett.1c00453. ). With observations of sorption to organic material ( Hu et al. 2023 [BFCN5BLS] Hu, Ximin, Haoqi (Nina) Zhao, Zhenyu Tian, Katherine T. Peter, Michael C. Dodd, and Edward P. Kolodziej. 2023. “Chemical Characteristics, Leaching, and Stability of the Ubiquitous Tire Rubber–Derived Toxicant 6PPD-Quinone.” Environmental Science: Processes & Impacts 25 (5): 901–11. https://doi.org/10.1039/D3EM00047H. ), methods that provide a whole-water analysis ( Zhang et al. 2023 [D6T6D4JP] Zhang, Ruiling, Shizhen Zhao, Xin Liu, et al. 2023. “Aquatic Environmental Fates and Risks of Benzotriazoles, Benzothiazoles, and p-Phenylenediamines in a Catchment Providing Water to a Megacity of China.” Environmental Research 216 (January): 114721. https://doi.org/10.1016/j.envres.2022.114721. ) are important as a filtered direct-inject water method could miss concentrations in the sorbed fraction. Additional research is needed to understand rates of adsorption and the fate and transport of the dissolved versus suspended particle fractions of 6PPD-q and 6PPD.
5.2.2 Bottle Types and Laboratory Holding Times
6PPD: A thorough bottle comparison study has not been performed for 6PPD as this is challenging to investigate due to the short half-life. Approaches that have been investigated to prolong the 6PPD half-life include the use of free ozone scavengers, such as ascorbic acid, but the preservatives can cause stability issues during the analysis of 6PPD-q ( Woudneh 2023 [6S8L3YFK] Woudneh, Million. 2023. “Best Practices in the Analysis of 6PPD-Quinone.” ITRC Tire Anti-Degradants 6PPD Team Meeting, May 16. ).
6PPD-q: For holding times of more than a day, glass is recommended, and plastics should be avoided; stainless steel and PTFE can be used for shorter holding times under a day ( Lane et al. 2024 [Q3DSSIIU] Lane, Rachael F., Kelly L. Smalling, Paul M. Bradley, et al. 2024. “Tire-Derived Contaminants 6PPD and 6PPD-Q: Analysis, Sample Handling, and Reconnaissance of United States Stream Exposures.” Chemosphere, July 11, 142830. https://doi.org/10.1016/j.chemosphere.2024.142830. Hu et al. 2023 [BFCN5BLS] Hu, Ximin, Haoqi (Nina) Zhao, Zhenyu Tian, Katherine T. Peter, Michael C. Dodd, and Edward P. Kolodziej. 2023. “Chemical Characteristics, Leaching, and Stability of the Ubiquitous Tire Rubber–Derived Toxicant 6PPD-Quinone.” Environmental Science: Processes & Impacts 25 (5): 901–11. https://doi.org/10.1039/D3EM00047H. ). If plastic containers are used, the bottles can be rinsed with organic solvents to recover some sorbed 6PPD-q, but glass is recommended to avoid the losses and work of trying to recover the sorbed fraction. A U.S. Geological Survey (USGS) 5-month holding-time study with laboratory-generated 6PPD-q solutions showed significant sorption to high-density polyethylene, polypropylene, and polystyrene, with no significant sorption to glass. Holding times in laboratory solutions can be significantly different from environmental water samples, and in 75-day stormwater holding times there was variability in the stability with differences noted for headspace and storage temperature. Based on that data, the recommended storage conditions are glass bottles with minimal headspace and refrigeration (5°C). 6PPD-q was frozen and thawed five times in half-full amber glass bottles with no significant decrease in 6PPD-q concentrations ( Lane et al. 2024 [Q3DSSIIU] Lane, Rachael F., Kelly L. Smalling, Paul M. Bradley, et al. 2024. “Tire-Derived Contaminants 6PPD and 6PPD-Q: Analysis, Sample Handling, and Reconnaissance of United States Stream Exposures.” Chemosphere, July 11, 142830. https://doi.org/10.1016/j.chemosphere.2024.142830. ).
5.2.3 Abiotic and Biotic Laboratory Extraction Techniques for 6PPD and 6PPD-q
A variety of preparation techniques have been used to prepare abiotic and biotic samples for 6PPD and 6PPD-q analysis and are summarized and referenced in Table 5-2 and Table 5-3, respectively. This is intended to provide preliminary information about reported laboratory extraction techniques as of April 2024. Filtration, liquid/liquid extraction, and solid-phase extraction (SPE) can be used to clean up and concentrate surface water, stormwater, groundwater, surface runoff, snowmelt, and WWTP influent and effluent samples for 6PPD and 6PPD-q analysis. For laboratory solutions of 6PPD-q, the filter material with the highest reported recovery is glass-fiber filters ( Lane et al. 2024 [Q3DSSIIU] Lane, Rachael F., Kelly L. Smalling, Paul M. Bradley, et al. 2024. “Tire-Derived Contaminants 6PPD and 6PPD-Q: Analysis, Sample Handling, and Reconnaissance of United States Stream Exposures.” Chemosphere, July 11, 142830. https://doi.org/10.1016/j.chemosphere.2024.142830. ). The extraction of water-deployed passive samplers depends on the material that has been deployed and should follow manufacturer recommendations for extraction.
Air has been sampled for 6PPD and 6PPD-q using PUF to collect gas- and particle-phase chemicals with the airborne particulate matter using Sigma-2 passive samplers and with particles collected on quartz fiber filters and then solvent extracted before analysis ( Johannessen et al. 2022 [RYBDCBV4] Johannessen, Cassandra, Amandeep Saini, Xianming Zhang, and Tom Harner. 2022. “Air Monitoring of Tire-Derived Chemicals in Global Megacities Using Passive Samplers.” Environmental Pollution 314 (December): 120206. https://doi.org/10.1016/j.envpol.2022.120206. Cao et al. 2022 [VBAMJHA7] Cao, Guodong, Wei Wang, Jing Zhang, et al. 2022. “New Evidence of Rubber-Derived Quinones in Water, Air, and Soil.” Environmental Science & Technology 56 (7): 4142–50. https://doi.org/10.1021/acs.est.1c07376. Liang et al. 2022 [SZPLJY9T] Liang, Bowen, Jiehua Li, Bibai Du, Zibin Pan, Liang-Ying Liu, and Lixi Zeng. 2022. “E-Waste Recycling Emits Large Quantities of Emerging Aromatic Amines and Organophosphites: A Poorly Recognized Source for Another Two Classes of Synthetic Antioxidants.” Environmental Science & Technology Letters, June 30, acs.estlett.2c00366. https://doi.org/10.1021/acs.estlett.2c00366. ). PM2.5 can be collected on quartz fiber filters, extracted by serial sonication, and filtered using PTFE, polyethersulfone, or nylon filters (see Table 5-2 and Table 5-3). Soil and sediments have been extracted with serial ultrasonication and then filtered (through PTFE or nylon) prior to analysis (see Table 5-2 and Table 5-3).
Fish-tissue samples are prepared for 6PPD and 6PPD-q analysis by homogenization and then an extraction, such as QuEChERS (a SPE method that is quick, easy, cheap, effective, rugged, and safe) or sonication, followed by centrifugation and filtering ( Nair et al. 2023 [9V5ES4MI] Nair, Pranav, Jianxian Sun, Linna Xie, et al. 2023. “In Process: Synthesis and Toxicity Evaluation of Tire Rubber–Derived Quinones.” Preprint. Chemistry, June 20. https://doi.org/10.26434/chemrxiv-2023-pmxvc. Fang et al. 2023 [FFFKR3MY] Fang, Chanlin, Liya Fang, Shanshan Di, et al. 2023. “Characterization of N-(1,3-Dimethylbutyl)-N′-Phenyl-p-Phenylenediamine (6PPD)-Induced Cardiotoxicity in Larval Zebrafish (Danio Rerio).” Science of the Total Environment 882 (July): 163595. https://doi.org/10.1016/j.scitotenv.2023.163595. Hiki and Yamamoto 2022 [VQE4EZWI] Hiki, Kyoshiro, and Hiroshi Yamamoto. 2022. “The Tire-Derived Chemical 6PPD-Quinone Is Lethally Toxic to the White-Spotted Char Salvelinus leucomaenis pluvius but Not to Two Other Salmonid Species.” Environmental Science & Technology Letters 9 (12): 1050–55. https://doi.org/10.1021/acs.estlett.2c00683. Grasse et al. 2023 [WJHX578U] Grasse, Nico, Bettina Seiwert, Riccardo Massei, Stefan Scholz, Qiuguo Fu, and Thorsten Reemtsma. 2023. “Uptake and Biotransformation of the Tire Rubber–Derived Contaminants 6-PPD and 6-PPD Quinone in the Zebrafish Embryo (Danio rerio).” Environmental Science & Technology 57 (41): 15598–607. https://doi.org/10.1021/acs.est.3c02819. Zhang et al. 2023 [3FCHDXBN] Zhang, Shu-Yun, Xiufeng Gan, Baoguo Shen, et al. 2023. “6PPD and Its Metabolite 6PPDQ Induce Different Developmental Toxicities and Phenotypes in Embryonic Zebrafish.” Journal of Hazardous Materials 455 (August): 131601. https://doi.org/10.1016/j.jhazmat.2023.131601. Ji et al. 2022 [LDBNLUJS] Ji, Jiawen, Changsheng Li, Bingjie Zhang, et al. 2022. “Exploration of Emerging Environmental Pollutants 6PPD and 6PPDQ in Honey and Fish Samples.” Food Chemistry 396: 133640. https://doi.org/10.1016/j.foodchem.2022.133640. ). Fish plasma, blood, and bile are extracted by SPE or vortex-sonication/centrifuged prior to analysis for 6PPD and 6PPD-q ( Hägg et al. 2023 [9C6TC8JJ] Hägg, Fanny, Dorte Herzke, Vladimir A. Nikiforov, et al. 2023. “Ingestion of Car Tire Crumb Rubber and Uptake of Associated Chemicals by Lumpfish (Cyclopterus Lumpus).” Frontiers in Environmental Science 11 (October): 1219248. https://doi.org/10.3389/fenvs.2023.1219248. Mahoney et al. 2022 [V5HSELRG] Mahoney, Hannah, Francisco C. da Silva Junior, Catherine Roberts, et al. 2022. “Exposure to the Tire Rubber-Derived Contaminant 6PPD-Quinone Causes Mitochondrial Dysfunction In Vitro.” Environmental Science & Technology Letters 9 (9): 765–71. https://doi.org/10.1021/acs.estlett.2c00431. ). Human urine has been prepared for analysis using salting-out–assisted liquid−liquid extraction ( Du et al. 2022 [DWFYR89F] Du, Bibai, Bowen Liang, Yi Li, Mingjie Shen, Liang-Ying Liu, and Lixi Zeng. 2022. “First Report on the Occurrence of N-(1,3-Dimethylbutyl)-N′-Phenyl-p-Phenylenediamine (6PPD) and 6PPD-Quinone as Pervasive Pollutants in Human Urine from South China.” Environmental Science & Technology Letters, ahead of print, November 21. World. https://doi.org/10.1021/acs.estlett.2c00821. ). Lettuce has been prepared for analysis with serial bead beating followed by solvent extraction and nylon filtering ( Castan et al. 2023 [3RBDETGD] Castan, Stephanie, Anya Sherman, Ruoting Peng, et al. 2023. “Uptake, Metabolism, and Accumulation of Tire Wear Particle–Derived Compounds in Lettuce.” Environmental Science & Technology 57 (1): 168–78. https://doi.org/10.1021/acs.est.2c05660. ). Honey has been extracted with modified QuEChERS ( Ji et al. 2022 [LDBNLUJS] Ji, Jiawen, Changsheng Li, Bingjie Zhang, et al. 2022. “Exploration of Emerging Environmental Pollutants 6PPD and 6PPDQ in Honey and Fish Samples.” Food Chemistry 396: 133640. https://doi.org/10.1016/j.foodchem.2022.133640. ).
5.2.4 Analytical Method Approaches for 6PPD and 6PPD-q
After the preparation of biotic and abiotic samples, the most frequently applied analytical technique for 6PPD and 6PPD-q is liquid chromatography with mass spectrometry (LC-MS) (see Table 5-2 and Table 5-3). Gas chromatography / MS (GC/MS) ( Tian et al. 2021 [X8BRFG3P] Tian, Zhenyu, Haoqi Zhao, Katherine T. Peter, et al. 2021. “A Ubiquitous Tire Rubber–Derived Chemical Induces Acute Mortality in Coho Salmon.” Report. Science 371 (6525): 185–89. https://doi.org/10.1126/science.abd6951. Rauert et al. 2022 [9WERCXNS] Rauert, Cassandra, Nathan Charlton, Elvis D. Okoffo, et al. 2022. “Concentrations of Tire Additive Chemicals and Tire Road Wear Particles in an Australian Urban Tributary.” Environmental Science & Technology, ahead of print, January 31. World. https://doi.org/10.1021/acs.est.1c07451. ) can also be used but has not been as widely applied. LC-MS is frequently used because of low ng/L method detection limits, the ability to analyze a variety of biological and environmental samples, flexibility in quantitation, and the ability to provide structural elucidation for other unknow chemicals ( Cao et al. 2022 [LT2AYSFX] Cao, Guodong, Jing Zhang, Wei Wang, Pengfei Wu, Yi Ru, and Zongwei Cai. 2022. “Mass Spectrometry Analysis of a Ubiquitous Tire Rubber–Derived Quinone in the Environment.” TrAC Trends in Analytical Chemistry, 116756. https://doi.org/10.1016/j.trac.2022.116756. ). LC-MS is used to analyze 6PPD and 6PPD-q from abiotic and biotic matrices. 6PPD-q has been analyzed, but not always detected (for occurrences see Tables 4-1 through 4-10), in surface water; stormwater; groundwater; road runoff, snow; suspended particles; dust; PM2.5; influent and effluent from WWTP and drinking water treatment plants; soil; sediment; biosolids; human urine; mammalian cells; fish or mollusk tissues, fish bile, and fish plasma; and food (including lettuce and honey). with corresponding reporting limits listed in Table 5-2 and Table 5-3. 6PPD has been analyzed, but not always detected (for occurrences see Tables 4-1 through 4-10), in the same or similar media as were measured for 6PPD-q, with corresponding reporting limits listed in Table 5-2 and Table 5-3.
5.2.4.1 MS2 Targeted and Nontargeted
Liquid chromatography (LC) or GC with targeted analysis, semi-targeted analysis, suspect screening, and nontargeted analysis has been used in the analysis of 6PPD-q and 6PPD. Commonly monitored ions for 6PPD and 6PPD-q during multiple reaction monitoring and targeted screenings are listed in Table 5-2 and Table 5-3, respectively. High-resolution MS (HRMS) can be used for targeted analysis and is an MS technique that is gaining popularity because a full scan is collected (even during a targeted analysis), which results in capturing additional information so that transformation products of unknown compounds related to 6PPD, 6PPD-q, or tire chemicals can be elucidated ( Seiwert et al. 2022 [QDRRVWMW] Seiwert, Bettina, Maolida Nihemaiti, Mareva Troussier, Steffen Weyrauch, and Thorsten Reemtsma. 2022. “Abiotic Oxidative Transformation of 6-PPD and 6-PPD Quinone from Tires and Occurrence of Their Products in Snow from Urban Roads and in Municipal Wastewater.” Water Research 212: 118122. https://doi.org/10.1016/j.watres.2022.118122. Cao et al. 2022 [LT2AYSFX] Cao, Guodong, Jing Zhang, Wei Wang, Pengfei Wu, Yi Ru, and Zongwei Cai. 2022. “Mass Spectrometry Analysis of a Ubiquitous Tire Rubber–Derived Quinone in the Environment.” TrAC Trends in Analytical Chemistry, 116756. https://doi.org/10.1016/j.trac.2022.116756. ). As was demonstrated by Müller et al. ( Müller et al. 2022 [QJXVBLCK] Müller, Kathrin, Daniel Hübner, Sven Huppertsberg, Thomas P. Knepper, and Daniel Zahn. 2022. “Probing the Chemical Complexity of Tires: Identification of Potential Tire-Borne Water Contaminants with High-Resolution Mass Spectrometry.” Science of The Total Environment 802: 149799. https://doi.org/10.1016/j.scitotenv.2021.149799. ), this can be advantageous in screening a large number of unknowns related to tire chemicals while also identifying 6PPD and 6PPD-q.
5.2.4.2 Other Techniques
Other techniques that have been investigated for the sampling or detection of 6PPD-q and 6PPD but not widely applied. For the sampling of 6PPD-q condensed phase membrane introduction mass spectrometry (CP-MIMS) with a semipermeable polydimethylsiloxane capillary hollow fiber membrane has been used ( Monaghan et al. 2021 [RKMTS6DI] Monaghan, Joseph, Angelina Jaeger, Alon R. Agua, et al. 2021. “A Direct Mass Spectrometry Method for the Rapid Analysis of Ubiquitous Tire-Derived Toxin N-(1,3-Dimethylbutyl)-N′-Phenyl-p-Phenylenediamine Quinone (6-PPDQ).” Environmental Science & Technology Letters 8 (12): 1051–56. https://doi.org/10.1021/acs.estlett.1c00794. ). The ASTM-D5666 standard method is available for ascertaining the purity of PPDs by high-performance liquid chromatography (HPLC) ultraviolet detection ( ASTM International 2023 [JGR7UE66] ASTM International. 2023. ASTM-D5666 | Standard Test Method for Rubber Chemical Antidegradants; Purity of p-Phenylenediamine (PPD) Antidegradants by High Performance Liquid Chromatography. ASTM-D5666-95R23. https://www.document-center.com/standards/show/ASTM-D5666. ). Ultraviolet-visible spectrometry analysis has been used for some 6PPD research and in the identification of transformation products ( Cataldo et al. 2015 [JFXS3CPR] Cataldo, Franco, Brad Faucette, Semone Huang, and Warren Ebenezer. 2015. “On the Early Reaction Stages of Ozone with N,N′-Substituted p-Phenylenediamines (6PPD, 77PD) and N,N′,N″-Substituted-1,3,5-Triazine ‘Durazone®’: An Electron Spin Resonance (ESR) and Electronic Absorption Spectroscopy Study.” Polymer Degradation and Stability 111 (January): 223–31. https://doi.org/10.1016/j.polymdegradstab.2014.11.011. Li et al. 2023 [3EFLHAGA] Li, Chenguang, Yanlei Zhang, Shiqi Yin, et al. 2023. “First Insights into 6PPD-Quinone Formation from 6PPD Photodegradation in Water Environment.” Journal of Hazardous Materials 459 (October): 132127. https://doi.org/10.1016/j.jhazmat.2023.132127. Zhao et al. 2023 [ENE6F3HC] Zhao, Haoqi Nina, Ximin Hu, Zhenyu Tian, et al. 2023. “Transformation Products of Tire Rubber Antioxidant 6PPD in Heterogeneous Gas-Phase Ozonation: Identification and Environmental Occurrence.” Environmental Science & Technology 57 (14): 5621–32. https://doi.org/10.1021/acs.est.2c08690. ) and in measurement of 6PPD-q standards ( Tian et al. 2021 [X8BRFG3P] Tian, Zhenyu, Haoqi Zhao, Katherine T. Peter, et al. 2021. “A Ubiquitous Tire Rubber–Derived Chemical Induces Acute Mortality in Coho Salmon.” Report. Science 371 (6525): 185–89. https://doi.org/10.1126/science.abd6951. ).
5.2.4.3 Rubber Products
Analytical techniques have been applied to understand the leaching of chemicals from rubber products. When preparing rubber products for analysis, consideration should be given to the preparation technique; techniques such as sample grinding can increase surface area and the formation of 6PPD-q. Differences have been observed in chemicals leaching from TWPs and CMTT; TWP leachates were dominated by transformation products, while CMTT was dominated by rubber parent materials (6PPD), diphenylguanidine, and mercaptobenzothiazole ( Weyrauch et al. 2023 [T89H6LNJ] Weyrauch, Steffen, Bettina Seiwert, Milena Voll, Stephan Wagner, and Thorsten Reemtsma. 2023. “Accelerated Aging of Tire and Road Wear Particles by Elevated Temperature, Artificial Sunlight and Mechanical Stress — A Laboratory Study on Particle Properties, Extractables and Leachables.” Science of the Total Environment 904 (December): 166679. https://doi.org/10.1016/j.scitotenv.2023.166679. ). Aging of rubber materials, especially sunlight photodegradation, further changes the leached chemicals to more transformation products ( Weyrauch et al. 2023 [T89H6LNJ] Weyrauch, Steffen, Bettina Seiwert, Milena Voll, Stephan Wagner, and Thorsten Reemtsma. 2023. “Accelerated Aging of Tire and Road Wear Particles by Elevated Temperature, Artificial Sunlight and Mechanical Stress — A Laboratory Study on Particle Properties, Extractables and Leachables.” Science of the Total Environment 904 (December): 166679. https://doi.org/10.1016/j.scitotenv.2023.166679. ). See Section 3.6 for additional information about biodegradation of CMTT.
To analyze the bioavailable fraction of crumb rubber used on synthetic turf sport fields, researchers used ultrasound-assisted extraction coupled with an in vitro simulation of mammalian digestion. The researchers optimized this approach for polyaromatic hydrocarbons and also analyzed for the bioavailable fraction of 6PPD-q with GC/MS suspect screening. ( Armada et al. 2023 [AHX5WWPV] Armada, Daniel, Antia Martinez-Fernandez, Maria Celeiro, Thierry Dagnac, and Maria Llompart. 2023. “Assessment of the Bioaccessibility of PAHs and Other Hazardous Compounds Present in Recycled Tire Rubber Employed in Synthetic Football Fields.” Science of the Total Environment 857: 159485. https://doi.org/10.1016/j.scitotenv.2022.159485. ). Tire particles have also been investigated with the fish in vitro digestive model and co-ingestion experiments to create digestate solutions that were analyzed by UHPLC-HRMS ( Masset et al. 2022 [UGNACB4V] Masset, Thibault, Benoit J. D. Ferrari, William Dudefoi, et al. 2022. “Bioaccessibility of Organic Compounds Associated with Tire Particles Using a Fish In Vitro Digestive Model: Solubilization Kinetics and Effects of Food Coingestion.” Environmental Science & Technology 56 (22): 15607–16. https://doi.org/10.1021/acs.est.2c04291. ). Leaching from crumb rubber has also been explored with solvent and water extractions and analyzed by LC-MS/MS ( Zhao et al. 2023 [ENE6F3HC] Zhao, Haoqi Nina, Ximin Hu, Zhenyu Tian, et al. 2023. “Transformation Products of Tire Rubber Antioxidant 6PPD in Heterogeneous Gas-Phase Ozonation: Identification and Environmental Occurrence.” Environmental Science & Technology 57 (14): 5621–32. https://doi.org/10.1021/acs.est.2c08690. ).
5.2.5 Considerations for Measuring 6PPD
Methods for measuring 6PPD have not been as widely reported due to the relatively short half-life of 6PPD in both environmental and laboratory conditions. Transformation products (including hydrolysis products) are quickly formed once 6PPD is in water or, to a lesser degree, in organic solvents (for example, methanol, acetonitrile, toluene). Limited information is available on the transformation products of 6PPD, but 6PPD-q is known to occur as a transformation product in the environment ( Seiwert et al. 2022 [QDRRVWMW] Seiwert, Bettina, Maolida Nihemaiti, Mareva Troussier, Steffen Weyrauch, and Thorsten Reemtsma. 2022. “Abiotic Oxidative Transformation of 6-PPD and 6-PPD Quinone from Tires and Occurrence of Their Products in Snow from Urban Roads and in Municipal Wastewater.” Water Research 212: 118122. https://doi.org/10.1016/j.watres.2022.118122. Zeng et al. 2023 [TK5YR8WJ] Zeng, Lixi, Yi Li, Yuxin Sun, Liang-Ying Liu, Mingjie Shen, and Bibai Du. 2023. “Widespread Occurrence and Transport of p-Phenylenediamines and Their Quinones in Sediments across Urban Rivers, Estuaries, Coasts, and Deep-Sea Regions.” Environmental Science & Technology, January 31, acs.est.2c07652. https://doi.org/10.1021/acs.est.2c07652. Cao et al. 2022 [VBAMJHA7] Cao, Guodong, Wei Wang, Jing Zhang, et al. 2022. “New Evidence of Rubber-Derived Quinones in Water, Air, and Soil.” Environmental Science & Technology 56 (7): 4142–50. https://doi.org/10.1021/acs.est.1c07376. ). Therefore, due to the relative reactivity of 6PPD, the methods can only generate an estimated level of 6PPD in environmental samples. Preservatives and pH modifiers have been investigated as ways to stabilize 6PPD, but these additives negatively impact the analysis of 6PPD-q, compromising the sample; the current recommendation for 6PPD analysis by LC-MS is to minimize holding times and direct-injection to minimize both processing and losses ( Woudneh 2023 [6S8L3YFK] Woudneh, Million. 2023. “Best Practices in the Analysis of 6PPD-Quinone.” ITRC Tire Anti-Degradants 6PPD Team Meeting, May 16. ). Monitoring the ions for 6PPD in MS spectrometry methods can provide presence/absence information in consumer goods and TRWP-laden samples that show positive detections for 6PPD that can act as a reservoir for increased 6PPD-q formation.
5.2.5.1 Standard or Approved Methods for 6PPD
Currently there are no standardized or approved methods for measuring 6PPD. The National Oceanic and Atmospheric Administration (NOAA) and the USGS have included 6PPD in their 6PPD-q methods and provide an estimate of 6PPD concentrations ( Lane et al. 2024 [Q3DSSIIU] Lane, Rachael F., Kelly L. Smalling, Paul M. Bradley, et al. 2024. “Tire-Derived Contaminants 6PPD and 6PPD-Q: Analysis, Sample Handling, and Reconnaissance of United States Stream Exposures.” Chemosphere, July 11, 142830. https://doi.org/10.1016/j.chemosphere.2024.142830. Mahoney et al. 2022 [V5HSELRG] Mahoney, Hannah, Francisco C. da Silva Junior, Catherine Roberts, et al. 2022. “Exposure to the Tire Rubber-Derived Contaminant 6PPD-Quinone Causes Mitochondrial Dysfunction In Vitro.” Environmental Science & Technology Letters 9 (9): 765–71. https://doi.org/10.1021/acs.estlett.2c00431. ).
5.2.5.2 Detecting 6PPD in Consumer Products
Techniques that can be applied to identify 6PPD in consumer products include HPLC ( Ikarashi and Kaniwa 2000 [8KFPXSNG] Ikarashi, Yoshiaki, and Masa-aki Kaniwa. 2000. “Determination of P-Phenylenediamine and Related Antioxidants in Rubber Boots by High Performance Liquid Chromatography. Development of an Analytical Method for N-(1-Methylheptyl)-N’-Phenyl-p-Phenylenediamine.” Journal of Health Science 46 (6): 467–73. https://doi.org/10.1248/jhs.46.467. Poldushova et al. 2016 [6S6C5F9Z] Poldushova, G. A., K. L. Kandyrin, and S. V. Reznichenko. 2016. “The Effect of the Structure of p -Phenylenediamine Antiagers on the Physicomechanical and Hysteresis Properties of Filled Rubber Compounds.” International Polymer Science and Technology 43 (2): 19–22. https://doi.org/10.1177/0307174X1604300205. Lokesh et al. 2023 [LBXMIT5W] Lokesh, Srinidhi, Siththarththan Arunthavabalan, Elie Hajj, Edgard Hitti, and Yu Yang. 2023. “Investigation of 6PPD-Quinone in Rubberized Asphalt Concrete Mixtures.” ACS Environmental Au, ahead of print, July 26. https://doi.org/10.1021/acsenvironau.3c00023. ), LC-MS ( Ikarashi and Kaniwa 2000 [8KFPXSNG] Ikarashi, Yoshiaki, and Masa-aki Kaniwa. 2000. “Determination of P-Phenylenediamine and Related Antioxidants in Rubber Boots by High Performance Liquid Chromatography. Development of an Analytical Method for N-(1-Methylheptyl)-N’-Phenyl-p-Phenylenediamine.” Journal of Health Science 46 (6): 467–73. https://doi.org/10.1248/jhs.46.467. Cao et al. 2022 [VBAMJHA7] Cao, Guodong, Wei Wang, Jing Zhang, et al. 2022. “New Evidence of Rubber-Derived Quinones in Water, Air, and Soil.” Environmental Science & Technology 56 (7): 4142–50. https://doi.org/10.1021/acs.est.1c07376. ), GC/MS ( Shetye and Ambare 2018 [YK73YHYB] Shetye, Sugandha S., and Satish N. Ambare. 2018. “Pyrolysis Gas Chromatography Mass Spectrometry: A Efficient Technique for Identification and Quantification of Rubber Antioxident P-Phenylene Diamine (6PPD).” International Journal of Research and Analytical Reviews 5 (2): 949–54. http://ijrar.com/upload_issue/ijrar_issue_920.pdf. Armada et al. 2022 [XZYEATEB] Armada, Daniel, Maria Celeiro, Thierry Dagnac, and Maria Llompart. 2022. “Green Methodology Based on Active Air Sampling Followed by Solid Phase Microextraction and Gas Chromatography-Tandem Mass Spectrometry Analysis to Determine Hazardous Substances in Different Environments Related to Tire Rubber.” Journal of Chromatography A 1668: 462911. https://doi.org/10.1016/j.chroma.2022.462911. Skoczyńska et al. 2021 [THG8LDSG] Skoczyńska, Ewa, Pim E. G. Leonards, Maria Llompart, and Jacob de Boer. 2021. “Analysis of Recycled Rubber: Development of an Analytical Method and Determination of Polycyclic Aromatic Hydrocarbons and Heterocyclic Aromatic Compounds in Rubber Matrices.” Chemosphere 276: 130076. https://doi.org/10.1016/j.chemosphere.2021.130076. ), QTOF/MS ( Cao et al. 2022 [VBAMJHA7] Cao, Guodong, Wei Wang, Jing Zhang, et al. 2022. “New Evidence of Rubber-Derived Quinones in Water, Air, and Soil.” Environmental Science & Technology 56 (7): 4142–50. https://doi.org/10.1021/acs.est.1c07376. ), thermal desorption (TD), and pyrolysis-GC/MS (pryo-GC/MS) ( Shetye and Ambare 2018 [YK73YHYB] Shetye, Sugandha S., and Satish N. Ambare. 2018. “Pyrolysis Gas Chromatography Mass Spectrometry: A Efficient Technique for Identification and Quantification of Rubber Antioxident P-Phenylene Diamine (6PPD).” International Journal of Research and Analytical Reviews 5 (2): 949–54. http://ijrar.com/upload_issue/ijrar_issue_920.pdf. More et al. 2023 [28DQ7TYQ] More, Sharlee L., Julie V. Miller, Stephanie A. Thornton, Kathy Chan, Timothy R. Barber, and Kenneth M. Unice. 2023. “Refinement of a Microfurnace Pyrolysis-GC–MS Method for Quantification of Tire and Road Wear Particles (TRWP) in Sediment and Solid Matrices.” Science of the Total Environment 874 (May): 162305. https://doi.org/10.1016/j.scitotenv.2023.162305. ).
The following description of 6PPD analysis in consumer products was compiled from the references cited in the preceding paragraph. Consumer products are cut down to micro-sized particles via cryogenic grinding (or cyromilling) to a length less than 5 mm. The subsequent apparatus used depends on the specific instrumentation used. For example, inductively coupled plasma / MS (ICP/MS) uses glass vials and then the particles would be transferred into polyethylene sample holders for analysis. As another example, TD would use quartz sampling tubes. Density separation is not necessary when working with a known consumer product. Procedural steps are based on which specific instrumentation is used to analyze the sample. One of the least complicated methods is pyro-GC/MS. For example, with HPLC, LC-MS, and ICP/MS, acid digestion may be a necessary first step depending upon the type of polymer rubber of the consumer product; this adds time to the analysis process and is less environmentally friendly.
For LC-MS, the milled consumer sample is prepared with solvent extraction via centrifugation, shaking, or sonication and concentrated via blowdown, solvent accelerator extraction, or plastic-free stream with nitrogen. Cleanup steps can include syringe filter or SPE. With TD and pyro-GC/MS, there are three types of quartz sample tubes to choose from depending on the volatility of the consumer sample: the double open-ended, single open-ended, and slit. The tube is conditioned by passing through a hot flame, such as a Bunsen burner or butane flame, and a small amount of consumer sample is added to the quartz tube and pyrolyzed. A well-characterized National Institute of Standards and Technology rubber sample is used as a reference, and a total ion count chromatogram is used to identify patterns of ions and major chemical markers of tire rubber.
5.2.5.3 6PPD Commercial Standards and Isotopically Labeled Surrogate or Internal Standards
6PPD is available from a range of commercial vendors as a solid standard and is stable in this solid form until the use-by date provided by the manufacturer. An isotopically labeled 6PPD internal standard is not commercially available, and the following chemicals have been used as surrogate and internal standards: D5-6PPD-q, 6PPD-q-13C6, aniline-d5, atrazine-d5, benzophenone-d10, benzothiazole-d4, caffeine-13C3, coumaphos-d10, 16diphenylamine-d10, diphenylurea-d10, 5-methylbenzotriazole-d6, melamine-13C3, progesterone-d9, and pyrene-d10 (see Table 5-2).
5.2.6 Considerations for Measuring 6PPD-q
During the discovery and purification of 6PPD-q ( Tian et al. 2021 [X8BRFG3P] Tian, Zhenyu, Haoqi Zhao, Katherine T. Peter, et al. 2021. “A Ubiquitous Tire Rubber–Derived Chemical Induces Acute Mortality in Coho Salmon.” Report. Science 371 (6525): 185–89. https://doi.org/10.1126/science.abd6951. ), a variety of analytical techniques were used to isolate and identify 6PPD-q. Because stormwater is so complex, Z. Tian et al. fractionated the stormwater using sand filtration, ion exchange, XAD-2 fractionation, silica gel fractionation, parallel HPLC fractionation, and sequential HPLC fractionation, and they tested each fraction for coho salmon toxicity. Z. Tian et al. ( Tian et al. 2021 [X8BRFG3P] Tian, Zhenyu, Haoqi Zhao, Katherine T. Peter, et al. 2021. “A Ubiquitous Tire Rubber–Derived Chemical Induces Acute Mortality in Coho Salmon.” Report. Science 371 (6525): 185–89. https://doi.org/10.1126/science.abd6951. ) elucidated the compounds in the toxic fraction with LC and GC for separation and QTOF and orbitrap HRMS (UPLC-QTOF-MS/MS, UPLC-Orbitrap-MSn, GC-QTOF-HRMS) detection. These techniques for investigating unknown compounds in complex mixtures, along with nuclear magnetic resonance data for confirmation, identified 6PPD-q.
Stormwater and surface water can have high turbidities, and because 6PPD sorbs to organic material ( Hu et al. 2023 [BFCN5BLS] Hu, Ximin, Haoqi (Nina) Zhao, Zhenyu Tian, Katherine T. Peter, Michael C. Dodd, and Edward P. Kolodziej. 2023. “Chemical Characteristics, Leaching, and Stability of the Ubiquitous Tire Rubber–Derived Toxicant 6PPD-Quinone.” Environmental Science: Processes & Impacts 25 (5): 901–11. https://doi.org/10.1039/D3EM00047H. ), it is important to use a method that provides whole-water analysis, including suspended materials. Laboratory rubber materials, silicone, and parafilm also have a higher capacity for sorption and should be avoided ( Hu et al. 2023 [BFCN5BLS] Hu, Ximin, Haoqi (Nina) Zhao, Zhenyu Tian, Katherine T. Peter, Michael C. Dodd, and Edward P. Kolodziej. 2023. “Chemical Characteristics, Leaching, and Stability of the Ubiquitous Tire Rubber–Derived Toxicant 6PPD-Quinone.” Environmental Science: Processes & Impacts 25 (5): 901–11. https://doi.org/10.1039/D3EM00047H. Woudneh 2023 [6S8L3YFK] Woudneh, Million. 2023. “Best Practices in the Analysis of 6PPD-Quinone.” ITRC Tire Anti-Degradants 6PPD Team Meeting, May 16. ). Rubber laboratory materials should also be avoided to prevent background contamination of 6PPD or 6PPD-q.
5.2.6.1 Finding a Laboratory
Commercial, public, and research laboratories are available for the analysis of 6PPD-q. When selecting a laboratory, be sure it provides the analytical rigor required for project or program goals. Laboratory method accreditation, method detection limits, sample holding times, and quality control parameters (laboratory blanks, laboratory duplicate samples, spike recoveries, method verification standards) should be reviewed to ensure data will meet the desired quality and reproducibility. Analytical method accreditation requirements vary by state, organization, and agency. Laboratory accreditation in the state of Washington is offered by WA Ecology. A list of WA Ecology accredited labs is available at Home – Lab Search (wa.gov)
5.2.6.2 Standard or Approved Methods for 6PPD-q
Options for the analysis of 6PPD-q include commercial, public, and research laboratories. Methods of analysis in water have been published by several organizations and are summarized below.
5.2.6.2.1 USEPA Draft Method 1634
The USEPA’s OW Draft Method 1634 for the analysis of 6PPD-q in storm and surface water specifies headspace-free samples collected in 250-mL amber glass bottles with PTFE-lined caps, with samples stored between 0°C and 6°C but not frozen. These samples, which may be held for up to 14 days, have an aliquot of the extracted internal standard (EIS), 13C6-6PPD-q, and are then extracted using Phenomenex Strata-XL, 100-µm polymeric reversed-phase 200-mg, or equivalent, SPE cartridges. The SPE column is rinsed with a 5-mL aliquot of 50:50 methanol:water and then extracted with two 5-mL aliquots of acetonitrile. The non-EIS, D5-6PPD-q, is added to the 10-mL extract volume, and a 50-uL aliquot injected onto the LC-MS/MS system. Analyte separation is accomplished on a C18 column using a 0.2% formic acid in water and acetonitrile mobile phase that has a 10-minute run time. The isotope dilution method is used to quantitate 6PPD-q. The EIS recoveries are also determined using the NIS and are used as an indicator of analytical data quality. The minimum level of quantification for the method is 2 ng/L and is derived from a single-laboratory validation study.
5.2.6.2.2 Washington State Department of Ecology
“Standard Operating Procedure (SOP): Extraction and Analysis of 6PPD-q” (Mel730136, Version 1.2, approved 6/3/2023) contains procedures for the extraction and analysis of water for 6PPD-q by triple quadrupole MS ( Washington State Department of Ecology 2023 [HJQ3HEWU] Washington State Department of Ecology. 2023. “Standard Operating Procedure (SOP): Extraction and Analysis of 6PPD-Quinone (Mel730136, Version 1.2).” June 3. ). Water samples are collected headspace-free in 250-mL amber glass bottles with Teflon™-lined caps according to the Quality Assurance Project Plan: Monitoring of Tire Contaminants in Coho Salmon Watersheds. Samples are stored above freezing to 6°C and may be held for up to 28 days until extraction by SPE. Compounds that can be used as the EIS or injected internal standard are D5-6PPD-q and 13C6-6PPD-q. The SPE column is conditioned with a 5-mL aliquot of acetonitrile and 10-mL of Milli-Q water, rinsed with 5-mL of 1:1 methanol:water and 5-mL of hexane, then extracted with two 5-mL aliquots of acetonitrile. Analyte separation is accomplished on a biphenyl column using a 0.1% formic acid/water and 0.1% formic acid/acetonitrile mobile phase that has a 10.5-minute run time. The suggested reporting limit is 1 ng/L and the lower limit of quantitation for the instrument is suggested to be 0.025 ng/mL.
5.2.6.2.3 National Oceanic and Atmospheric Administration
The NOAA method, in development as of May 2024, is an LC-MS/MS method for the detection of 6PPD-q in water, fish bile, fish plasma, blubber, fish tissue, and shellfish (da Silva et al. In preparation). The procedure recommends sample collection in glass vials or bottles. Water samples are prepared with liquid/liquid extraction and concentrated, and the solvent is exchanged. The surrogate standard is D5-6PPD-q, and the internal standard is progesterone-D9. Bile and plasma are diluted and then extracted with SPE. Blubber, fish, and shellfish are extracted with an accelerated solvent extractor (ASE) with gravity-flow column cleanup and fractionation, then GPC cleanup. Analyte separation is accomplished on a C18 column. The detection limit for plasma is 0.0075–0.025 ng/mL, bile is 0.015–0.05 ng/mL, and fish tissue is 0.07 ng/g.
5.2.6.2.4 U.S. Geological Survey
The USGS direct-inject method is a UPLC-MS/MS method for the analysis of 6PPD-q in surface water ( Lane et al. 2024 [Q3DSSIIU] Lane, Rachael F., Kelly L. Smalling, Paul M. Bradley, et al. 2024. “Tire-Derived Contaminants 6PPD and 6PPD-Q: Analysis, Sample Handling, and Reconnaissance of United States Stream Exposures.” Chemosphere, July 11, 142830. https://doi.org/10.1016/j.chemosphere.2024.142830. ). Samples are collected in headspace-free amber glass bottles with Teflon™-lined caps and stored at 0°C–6°C for less than 14 days or frozen until analysis. Samples are 0.7-micron glass-fiber filtered, and the surrogate internal standard D5-6PPD-q is added. Analyte separation is accomplished on a C18 column using a 0.1% formic acid in water and acetonitrile mobile phase that has a 5-minute run time. The isotope dilution method is used to quantitate 6PPD-q, and the method reporting limit is 2 ng/L.
5.2.6.3 6PPD-q Commercial Standards and Isotopically Labeled Surrogate or Internal Standards
One of the initial limitations of 6PPD-q research was the lack of a reference standard for consistent accurate concentrations, which are important for correlating exposure concentrations to environmental detections. 6PPD-q standards, including two standards that are isotopically labeled (13C12-6PPD-q and 13C6-6PPD-q), are now available from multiple commercial vendors. An interferent with the 13C12-6PPD-q analog has been observed with some stormwater ( Eurofins 2023 [GZHAA9N4] Eurofins. 2023. Research Summary for the Single-Laboratory Validation Study of a Draft EPA LC-MS-MS Isotope Dilution Method for 6PPD-Quinone. https://www.epa.gov/system/files/documents/2024-01/final-research-summary-6ppd-q-11-30-23.pdf. ). Although matching isotopically labeled internal standards provide the best correction, other isotopically labeled internal standards have also been used: aniline-d5, atrazine-d5, benzophenone-d10, benzothiazole-d4, coumaphos-d10, caffeine-13C3, diphenylamine-d10, diphenylurea-d10, 5-methylbenzotriazole-d6, progesterone-d9, and pyrene-d10 (see Table 5-3).
5.3 Mapping and Modeling 6PPD-q and Potentially Vulnerable Ecosystems
The following text provides information on tools that can help focus sampling and mitigation efforts on 6PPD and 6PPD-q hot spots and potentially vulnerable ecological populations.
Although the causal link between 6PPD-q and URMS occurrences was first identified in the Pacific Northwest ( McIntyre et al. 2021 [MVL2LKBM] McIntyre, Jenifer K., Jasmine Prat, James Cameron, et al. 2021. “Treading Water: Tire Wear Particle Leachate Recreates an Urban Runoff Mortality Syndrome in Coho but Not Chum Salmon.” Environmental Science & Technology 55 (17): 11767–74. https://doi.org/10.1021/acs.est.1c03569. Kendra and Willms 1990 [BQ4XP54V] Kendra, Will, and Roger Willms. 1990. Recurrent Coho Salmon Mortality at Maritime Heritage Fish Hatchery, Bellingham: A Synthesis of Data Collected from 1987–1989. Washington State Department of Ecology, Environmental Services Program, Surface Water Investigations Section. https://apps.ecology.wa.gov/publications/documents/90e54.pdf. Scholz et al. 2011 [S8ASEIXU] Scholz, Nathaniel L., Mark S. Myers, Sarah G. McCarthy, et al. 2011. “Recurrent Die-Offs of Adult Coho Salmon Returning to Spawn in Puget Sound Lowland Urban Streams.” PLOS ONE 6 (12): e28013. https://doi.org/10.1371/journal.pone.0028013. Spromberg and Scholz 2011 [CT5HUEEI] Spromberg, Julann A., and Nathaniel L. Scholz. 2011. “Estimating the Future Decline of Wild Coho Salmon Populations Resulting from Early Spawner Die-Offs in Urbanizing Watersheds of the Pacific Northwest, USA.” Integrated Environmental Assessment and Management 7 (4): 648–56. https://doi.org/10.1002/ieam.219. ), the potential global extent of effects of 6PPD-q on aquatic life is unknown. 6PPD and 6PPD-q have been found in various environmental media (for example Seiwert et al. 2022 [QDRRVWMW] Seiwert, Bettina, Maolida Nihemaiti, Mareva Troussier, Steffen Weyrauch, and Thorsten Reemtsma. 2022. “Abiotic Oxidative Transformation of 6-PPD and 6-PPD Quinone from Tires and Occurrence of Their Products in Snow from Urban Roads and in Municipal Wastewater.” Water Research 212: 118122. https://doi.org/10.1016/j.watres.2022.118122. Monaghan et al. 2021 [RKMTS6DI] Monaghan, Joseph, Angelina Jaeger, Alon R. Agua, et al. 2021. “A Direct Mass Spectrometry Method for the Rapid Analysis of Ubiquitous Tire-Derived Toxin N-(1,3-Dimethylbutyl)-N′-Phenyl-p-Phenylenediamine Quinone (6-PPDQ).” Environmental Science & Technology Letters 8 (12): 1051–56. https://doi.org/10.1021/acs.estlett.1c00794. Challis et al. 2021 [T8TEWPCL] Challis, J. K., H. Popick, S. Prajapati, et al. 2021. “Occurrences of Tire Rubber–Derived Contaminants in Cold-Climate Urban Runoff.” Environmental Science & Technology Letters 8 (11): 961–67. https://doi.org/10.1021/acs.estlett.1c00682. Johannessen et al. 2022 [RYBDCBV4] Johannessen, Cassandra, Amandeep Saini, Xianming Zhang, and Tom Harner. 2022. “Air Monitoring of Tire-Derived Chemicals in Global Megacities Using Passive Samplers.” Environmental Pollution 314 (December): 120206. https://doi.org/10.1016/j.envpol.2022.120206. Greer et al. 2023 [P6RF5UFR] Greer, Justin B., Ellie M. Dalsky, Rachael F. Lane, and John D. Hansen. 2023. “Establishing an In Vitro Model to Assess the Toxicity of 6PPD-Quinone and Other Tire Wear Transformation Products.” Environmental Science & Technology Letters, ahead of print, May 2. https://doi.org/10.1021/acs.estlett.3c00196. Rauert et al. 2022 [9WERCXNS] Rauert, Cassandra, Nathan Charlton, Elvis D. Okoffo, et al. 2022. “Concentrations of Tire Additive Chemicals and Tire Road Wear Particles in an Australian Urban Tributary.” Environmental Science & Technology, ahead of print, January 31. World. https://doi.org/10.1021/acs.est.1c07451. Cao et al. 2022 [VBAMJHA7] Cao, Guodong, Wei Wang, Jing Zhang, et al. 2022. “New Evidence of Rubber-Derived Quinones in Water, Air, and Soil.” Environmental Science & Technology 56 (7): 4142–50. https://doi.org/10.1021/acs.est.1c07376. Nedrich 2022 [7LRY36T6] Nedrich, Sara. 2022. Preliminary Investigation of the Occurrence of 6PPD-Quinone in Michigan’s Surface Water. https://doi.org/10.13140/RG.2.2.34478.59204. ), but the concentrations and distribution of 6PPD and 6PPD-q has not been well characterized to date. The spatial distribution of 6PPD-q is not uniform across landscapes and depends on multiple factors (see Section 4: Occurrence, Fate, Transport, and Exposure Pathways). Areas where URMS has been observed in streams near high-traffic areas in the Pacific Northwest ( Ettinger et al. 2021 [HA49KGTT] Ettinger, A. K., E. R. Buhle, B. E. Feist, et al. 2021. “Prioritizing Conservation Actions in Urbanizing Landscapes.” Scientific Reports 11 (1): 818. https://doi.org/10.1038/s41598-020-79258-2. Feist et al. 2017 [4PSDP2BG] Feist, Blake E., Eric R. Buhle, David H. Baldwin, et al. 2017. “Roads to Ruin: Conservation Threats to a Sentinel Species across an Urban Gradient.” Ecological Applications 27 (8): 2382–96. https://doi.org/https://doi.org/10.1002/eap.1615. Spromberg and Scholz 2011 [CT5HUEEI] Spromberg, Julann A., and Nathaniel L. Scholz. 2011. “Estimating the Future Decline of Wild Coho Salmon Populations Resulting from Early Spawner Die-Offs in Urbanizing Watersheds of the Pacific Northwest, USA.” Integrated Environmental Assessment and Management 7 (4): 648–56. https://doi.org/10.1002/ieam.219. ) are assumed to correspond with high 6PPD-q concentrations. To better characterize potential risks and to strategically monitor URMS occurrences, scientists are developing spatially explicit sampling and assessment approaches ( Chen et al. 2023 [39YBXWMI] Chen, Xiaoli, Tao He, Xinlu Yang, et al. 2023. “Analysis, Environmental Occurrence, Fate and Potential Toxicity of Tire Wear Compounds 6PPD and 6PPD-Quinone.” Journal of Hazardous Materials 452 (June): 131245. https://doi.org/10.1016/j.jhazmat.2023.131245. ).
5.3.1 Data Layers and Tools
To date, there are no national databases or mapping tools dedicated to assessing 6PPD-q concentrations, effects to sensitive fish species, or associations between them. There are national data sets and mapping tools for landscape metrics that may help visualize stream crossing, traffic intensity, impervious surfaces, and other parameters that may be associated with 6PPD-q levels and delivery to streams. The occurrences of sensitive fish are available from national data sets via the Water Quality Portal, and lower density coverage is available via the USEPA National Aquatic Resource Surveys for lakes (National Lakes Assessment) and rivers/streams (National Rivers and Stream Assessment). Additional data processing is needed before mapping, and available data will not provide a census of every stream or waterbody. Furthermore, extirpation of sensitive fish species may have already occurred due to other causes ( Smith and Sklarew 2013 [EGWKDGVU] Smith, Albert K., and Dann Sklarew. 2013. “A Mid Atlantic Brook Trout (Salvelinus fontinalis) Stream Sustainability Statistic for Rating Non-Tidal Streams.” Sustainability of Water Quality and Ecology 1–2 (December): 68–81. https://doi.org/10.1016/j.swaqe.2013.08.001. ). Researchers have also developed coverages for projects not originally designed to address questions regarding 6PPD-q (for example, storm drain locations), which may nevertheless be useful for local and regional assessments.
Some local and regional data sets, mapping tools, and spatially explicit assessments are available, especially in the Pacific Northwest ( Washington State Department of Ecology 2022 [K2CG7KTE] Washington State Department of Ecology. 2022. 6PPD in Road Runoff Assessment and Mitigation Strategies. Nos. 22-03–020. Environmental Assessment and Water Quality Programs. https://apps.ecology.wa.gov/publications/documents/2203020.pdf. ), and efforts have increased to better assess the scope of the problem both locally and nationally. Table 5-6 lists some of the resources that are currently available.
Table 5-6. Selected mapping tools and other resources that may be useful for visualizing water quality conditions in support of resource and stormwater management
Notes: NOAA=National Oceanic and Atmospheric Administration, NREL=National Renewable Energy Laboratory, NWIFC=Northwest Indian Fisheries Commission, SWIFD=Statewide Integrated Fish Distribution, TNC=The Nature Conservancy, USDA=U.S. Department of Agriculture, USEPA=U.S. Environmental Protection Agency, USFWS=U.S. Fish and Wildlife Service, USGS=U.S. Geological Survey, WA Ecology=Washington State Department of Ecology, WA State=State of Washington, WDFW=Washington Department of Fish and Wildlife, WDOC=Washington State Department of Commerce, WaTech Solutions=Washington (State) Technology Solutions, WSDOT=Washington State Department of Transportation, WSU=Washington State University
5.3.2 Spatial Data for Relevant Land Surface Features
The nearness to impervious surfaces, roads, and their proximity to streams are factors that have been linked to URMS and higher levels of 6PPD-q in the environment ( Feist et al. 2017 [4PSDP2BG] Feist, Blake E., Eric R. Buhle, David H. Baldwin, et al. 2017. “Roads to Ruin: Conservation Threats to a Sentinel Species across an Urban Gradient.” Ecological Applications 27 (8): 2382–96. https://doi.org/https://doi.org/10.1002/eap.1615. Tian et al. 2022 [BICQHLBC] Tian, Zhenyu, Melissa Gonzalez, Craig A. Rideout, et al. 2022. “6PPD-Quinone: Revised Toxicity Assessment and Quantification with a Commercial Standard.” Environmental Science & Technology Letters, January 11, acs.estlett.1c00910. https://doi.org/10.1021/acs.estlett.1c00910. ). Because 6PPD in TRWP is a source of 6PPD-q in the environment, these land surface features and traffic density have been used to identify locations with potential for elevated 6PPD-q concentrations in water. To date, quantitative models for predicting 6PPD-q concentrations have not been developed or validated nationally ( Tian et al. 2022 [BICQHLBC] Tian, Zhenyu, Melissa Gonzalez, Craig A. Rideout, et al. 2022. “6PPD-Quinone: Revised Toxicity Assessment and Quantification with a Commercial Standard.” Environmental Science & Technology Letters, ahead of print, January 11. https://doi.org/10.1021/acs.estlett.1c00910. ).
Good national coverages of impervious surfaces, roads, and their proximity to streams are readily available; however, traffic density data are not available for all roads or may not be available from open access data sets. USGS data sets on rainfall and other geographical factors that affect surface runoff and dilution have been conveniently curated by USEPA (StreamCat) and can be modeled (for example, Soil and Water Assessment Tool) ( Arnold et al. 1998 [2WHDKL8S] Arnold, J. G., R. Srinivasan, R. S. Muttiah, and J. R. Williams. 1998. “Large Area Hydrologic Modeling and Assessment Part I: Model Development1.” JAWRA Journal of the American Water Resources Association 34 (1): 73–89. https://doi.org/10.1111/j.1752-1688.1998.tb05961.x. ). These data can be visualized with commercial mapping software or free open-source languages such as R and Python. These GIS software programs require some experience with GIS computing. No GIS experience is needed to visualize impervious surfaces, traffic, and road proximity to streams with the USEPA Freshwater Explorer mapping tool, which can be accessed from the USEPA Freshwater Explorer Landing page: https://www.epa.gov/water-research/freshwater-explorer from the add data widget.
As an example, Figure 5-1 uses data from the National Hydrography Dataset to create a map where streams (shown in red) cross major roads the U.S. highway system. Impervious surface has been linked with coho vulnerability ( Feist et al. 2017 [4PSDP2BG] Feist, Blake E., Eric R. Buhle, David H. Baldwin, et al. 2017. “Roads to Ruin: Conservation Threats to a Sentinel Species across an Urban Gradient.” Ecological Applications 27 (8): 2382–96. https://doi.org/https://doi.org/10.1002/eap.1615. ). As also shown in the figure, streams in urban areas near Seattle, Washington, and Portland, Oregon, have greater amounts of imperviousness, road crossings, and traffic in their watersheds than other areas. No data set perfectly depicts all the small streams that often serve as spawning habitat, so absence of depiction of a stream on maps should not be construed as lack of habitat for sensitive species and local knowledge and reconnaissance are recommended.
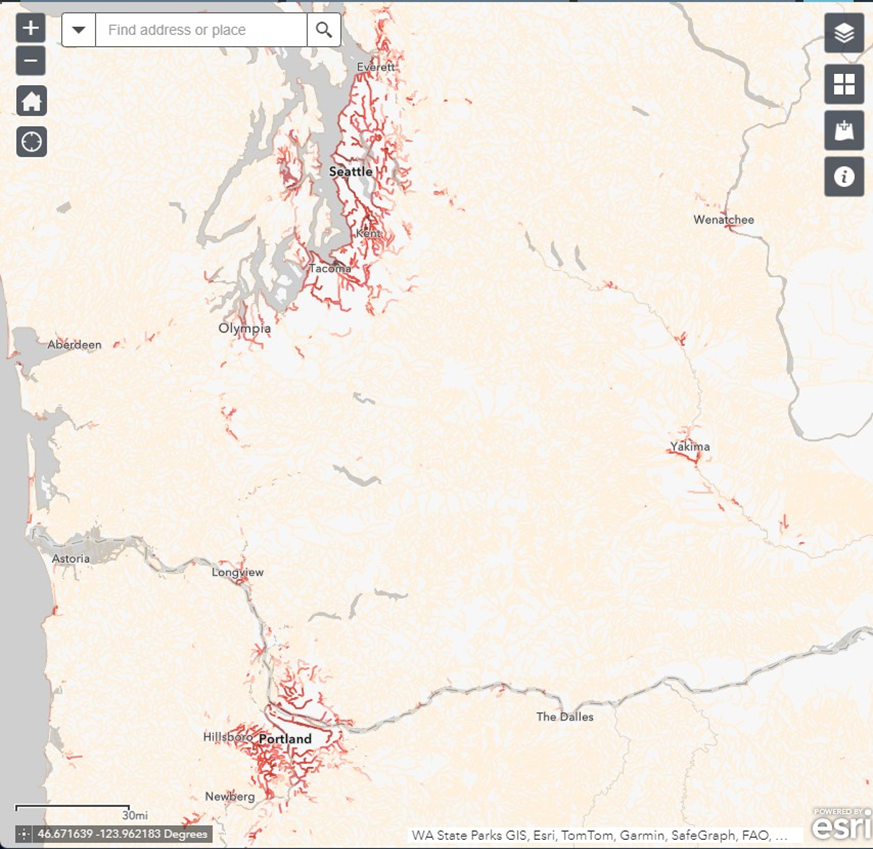
Figure 5-1. Depiction of distance of a stream from major roads in the northwestern United States using the National Hydrography Dataset
Source: USGS, National Hydrography Dataset
On a more local scale, more detail can be seen. The screenshot from the USEPA Freshwater Explorer (December 2023) in Figure 5-2 illustrates how spatial data can be used to depict information that may inform monitoring designs. The graphic shows streams color-coded for proximity to roads, with color warmth used to show stream proximity to roads (Figure 5-2). The inset box provides the data from a selected stream. In this example, the associated data box shows information for a segment of Beaverton Creek, Portland, Oregon (highlighted in turquoise), which has minor roads that cross it and is 147 m (about 482.28 feet) from a major road with 27,775 cars per day reported in a recent traffic count. (ESRI/Kalibrate TrafficMetrix. https://goto.arcgisonline.com/demographics5/USA_Traffic_Counts). Impervious cover is 52% and 63% for the watershed and the smaller catchment, respectively. Green areas in this satellite image are forests, and tan and gray areas are agricultural or urban areas.
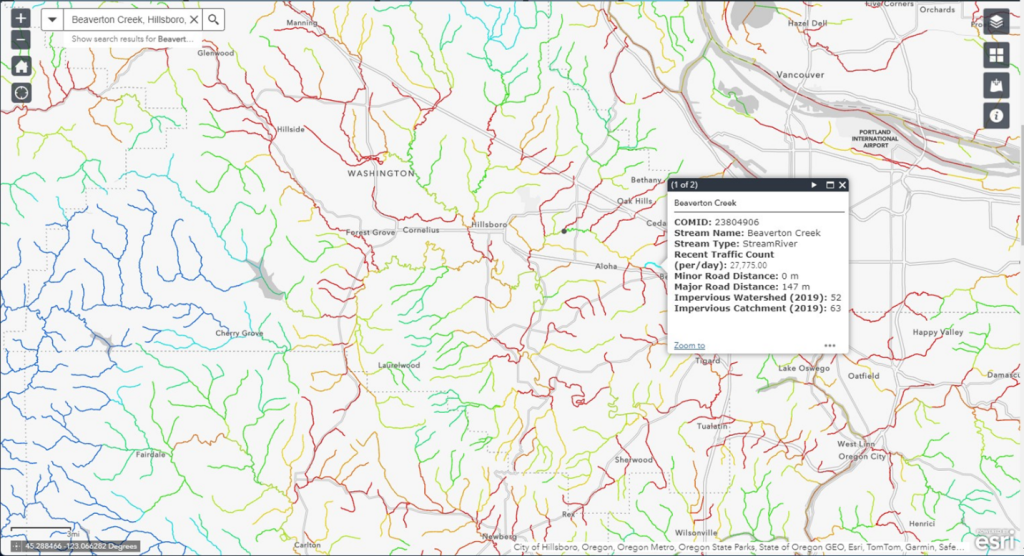
Figure 5-2. Streams are color-coded to indicate the proximity of stream to roads as part of a spatial data analysis that highlights the sources from which 6PPD-q enters streams.
Source: Screenshot from USEPA Freshwater Explorer, 20231005, Portland, Oregon
5.3.3 Fish Distribution
National data sets of the native range of fish species are available as well as occurrence data of fish species within and outside their native ranges. Distribution maps are shown for coho salmon (Figure 5-3), rainbow/steelhead trout (Figure 5-4), brook trout (Figure 5-5), and lake trout (Figure 5-6). The native ranges are shown in blue, and tan represents areas where one or more individuals were observed outside their native range. The boundaries of the geographic area drained by a river system or hydrologic unit used to make the maps are at the USGS 8-digit hydrologic unit level. For example, coho are native to the Pacific Northwest but have been introduced to the Great Lakes basin and the Northeast (see Figure 5-3) ( USGS 2023 [DT5PXSCQ] USGS. 2023. “Coho Salmon (Oncorhynchus kisutch) — Species Profile.” USGS Nonindigenous Aquatic Species Database. https://nas.er.usgs.gov/queries/factsheet.aspx?SpeciesID=908. ). Although rainbow, brook, and lake trout are much less sensitive to 6PPD-q than coho salmon, the distribution of these trout species across the United States is wider than the distribution of coho. A composite of native (blue) and introduced (tan) ranges of coho salmon and the three trout species noted above illustrates that fish sensitive to 6PPD-q are not limited to the Pacific coast (see Figure 1-3). Data for these maps were obtained from the USGS Nonindigenous Aquatic Species (NAS) database as of December 2023. Additional fish data (not shown here) are available from NOAA, USFW, USGS, and state fish and wildlife agencies.
Maps of the geographic distribution of native and non-native sensitive fish species.
(Click the image to enlarge)
Source: USGS Nonindigenous Aquatic Species (NAS) database.
 Figure 5-3 Coho salmon
 Figure 5-4 Rainbow trout / Steelhead
 Figure 5-5 Brook trout
 Figure 5-6 Lake trout

Figure 5-3 Coho salmon
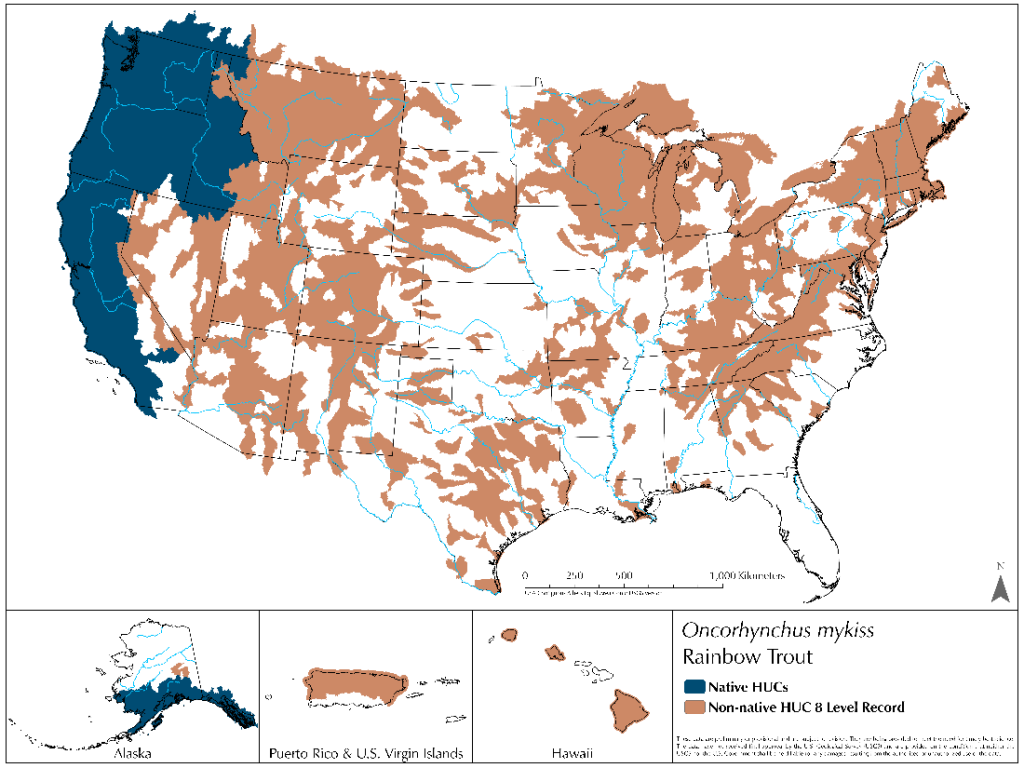
Figure 5-4 Rainbow trout / Steelhead
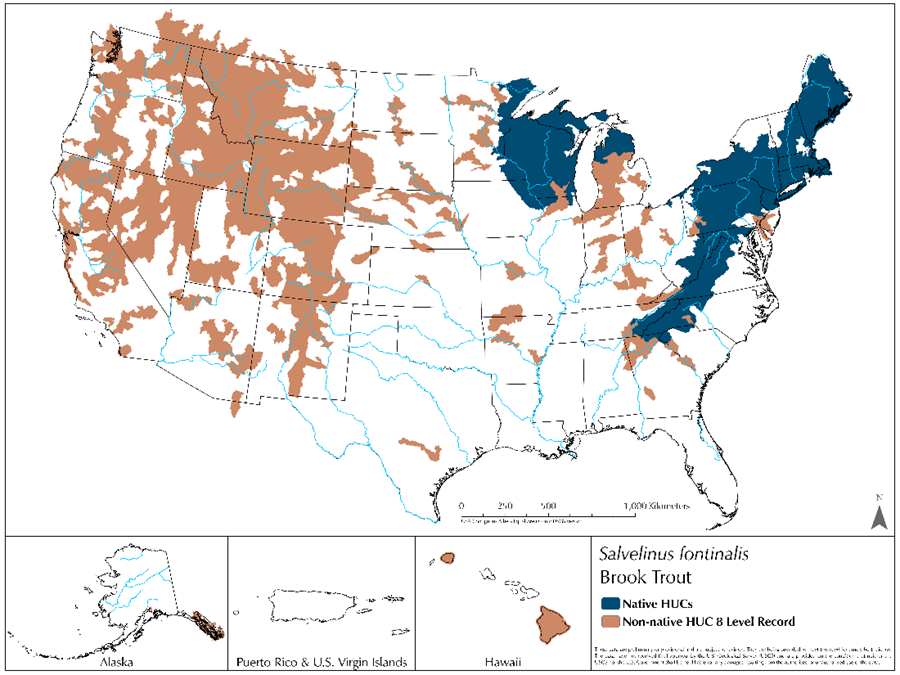
Figure 5-5 Brook trout

Figure 5-6 Lake trout
5.3.4 Scales of Occurrence, Exposure, and Risk
Desktop GIS can be applied at different scales to help identify toxic hotspots. These efforts are most effective when data infrastructure and resources are available to maintain the tools as new data layers are developed and new information becomes available.
As indicated in Section 5.3.1, there are currently no national databases or mapping tools dedicated to assessing the impact or prevalence of 6PPD or 6PPD-q in our nation’s waterways. While local data are available for select areas, the issue of data scarcity is further exacerbated by the variability of coverages among data sets with relevant environmental inputs. The lack of pertinent and analytically compatible information may limit the areas in which traditional modeling techniques can be applied. Alternatively, adjusting modeling approaches to available data may be more pragmatic and more broadly applicable. This is of particular interest because environmental proxies such as nationwide data sets for streamflow, traffic, and fish populations are more readily available than measured 6PPD or 6PPD-q. These parameters to estimate 6PPD loadings may be used in data-driven modeling techniques to estimate the potential exposure and effects of 6PPD in areas with little monitoring and 6PPD-q data.
As an example, the model used to generate maps by Feist et al. ( Feist et al. 2017 [4PSDP2BG] Feist, Blake E., Eric R. Buhle, David H. Baldwin, et al. 2017. “Roads to Ruin: Conservation Threats to a Sentinel Species across an Urban Gradient.” Ecological Applications 27 (8): 2382–96. https://doi.org/https://doi.org/10.1002/eap.1615. ) was used to develop an interactive visualization of the Predicted Mean Annual Coho Urban Runoff Mortality Syndrome Rates Across the Puget Sound ( USFWS et al. 2019 [ZBMYH66Y] USFWS, NOAA, and Washington State University. 2019. “Predicted Mean Annual Coho Runoff Mortality Syndrome Rates Across the Puget Sound.” https://www.arcgis.com/apps/webappviewer/index.html?id=53ea11d4125146628026b80241716962. ) (Figure 5-7). Users can visualize differences across the area and select drainage basins to see information such as the predicted mean percentage annual average coho spawner mortality and a brief characterization of the area. In both the published map and the interactive map (see Figure 5-7), red areas are predicted to have high mortality and yellow areas less mortality. The manuscript details the science, whereas information on the interactive map is more granular and adaptable to different assessment needs.
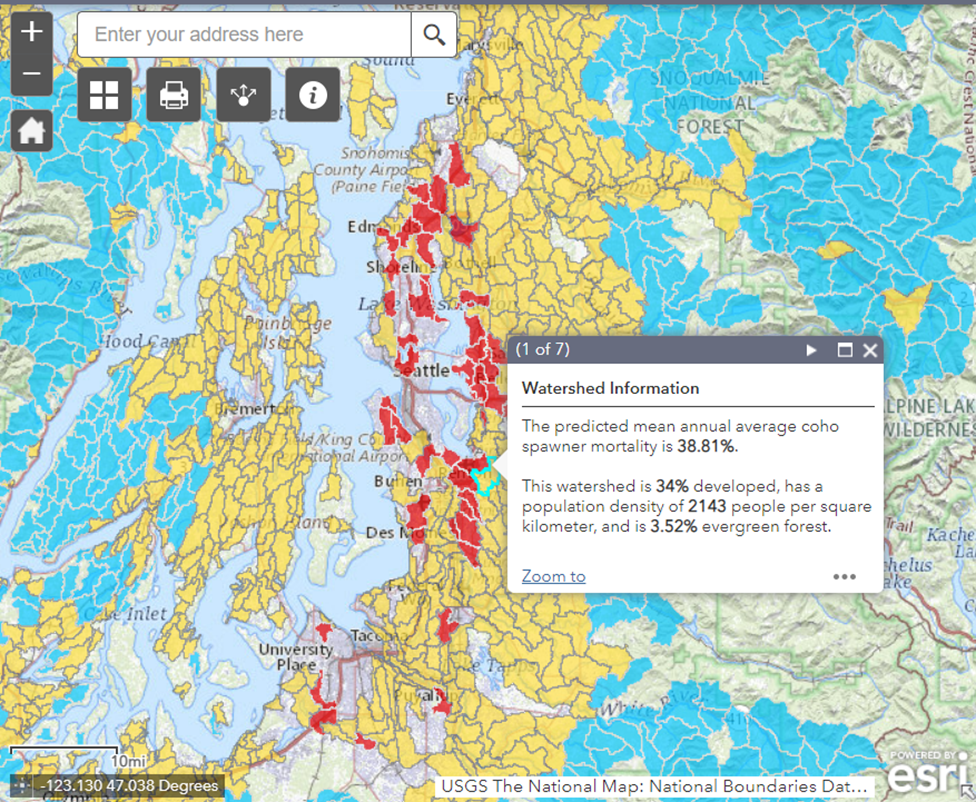
Figure 5-7. Mean annual spawner mortality urban runoff mortality syndrome.
Source: USFWS, NOAA, and Washington State University
(
USFWS et al. 2019 [ZBMYH66Y] USFWS, NOAA, and Washington State University. 2019. “Predicted Mean Annual Coho Runoff Mortality Syndrome Rates Across the Puget Sound.” https://www.arcgis.com/apps/webappviewer/index.html?id=53ea11d4125146628026b80241716962.
),
https://fws.maps.arcgis.com/apps/MapSeries/index.html?
appid=5dd4a36a2a5148a28376a0b81726a9a4
A variety of geographic data tools may be needed to address specific goals and scales of assessment. For example, a federal agency may be interested in a country-scale map and a state agency in a state-scale map. A tribe may want watershed-scale maps to design salmon or trout recovery programs. Initial goals may be related to mapping biological or environmental parameters or reconnaissance efforts. As data layers become more complete, spatially explicit data may become sufficient to build models to predict contaminant concentrations and estimate URMS in areas where sampling has not been done.
At smaller scales, it may also be possible to layer more detailed data for hotspot analyses. For example, a county-scale map may depict nonroad-based tire use areas such as playgrounds and fields using recycled tire or rubber or manufacturing facilities, tire recycling centers, landfills, and other facilities that could be sources of 6PPD/6PPD-q; this could help refine sampling locations. At finer scales depending on the local government, MS4s footprints and outfalls, combined sewer outfalls, and other stormwater discharge points may also be available and help refine hotspot mapping and source tracking.
An additional example of a statewide-scale tool is the tire contaminant in coho salmon watershed story map. This has an interactive web map to help guide sampling efforts across urban and traffic gradients and incorporates salmon and trout distributions (Figure 5-8).
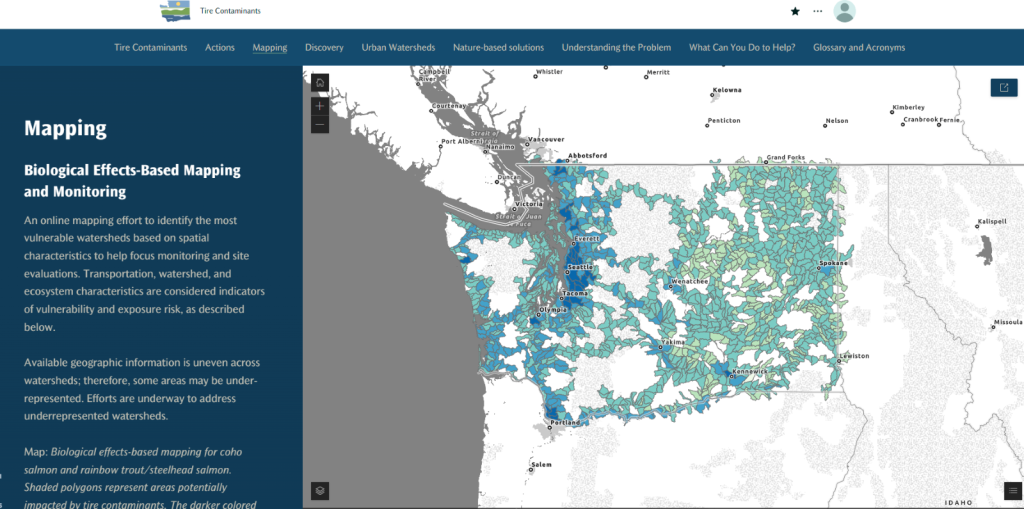
Figure 5-8. The Washington Department of Ecology Storymap helps visualize the potential occurrence of 6PPD-q along roadways near salmon-bearing waterbodies, which helps focus sampling efforts.
Source: Washington Department of Ecology website, Tire Contaminants (wa.gov)
5.3.5 Modeling to Support Regulation and Planning
5.3.5.1 Fate and Transport Modeling
5.3.5.1.1 Total Maximum Daily Load Modeling for Sinks, Sources, Occurrence, and Exposure
When a potentially harmful exposure or an adverse biological effect is observed, the CWA requires steps to reduce exposures and restore aquatic life use. Under Section 303(d) of the CWA, and in accordance with supporting regulations in 40 CFR Part 130.7, states are required to develop biennial lists of waters impaired or threatened by a pollutant. Under this regulation, “impaired” is used to refer to waters that fail to meet one or more applicable water quality standards. States are required to prepare a list of impaired waters that need a Total Maximum Daily Load (TMDL). TMDLs are calculated as the maximum pollutant quantity that a waterbody can receive. Water quality standards often define the water quality target in a TMDL. As part of developing TMDLs, allocation loads among the various point and nonpoint sources of the pollutant are also calculated. (For more information on CWA Section 303(d) Impaired Waters and TMDLs, visit: https://www.epa.gov/tmdl). The pollutants in this example are tire anti-degradants, and the adverse effect that requires remediation is fish survival and reproduction (see also Section 7.8: Clean Water Act).
Many strategies can be used to identify a water-quality target for a TMDL, but 6PPD-q is particularly challenging because of its acute toxicity and ubiquitous occurrence on and along transportation infrastructure ( Washington State Department of Ecology 2023 [M64YC38F] Washington State Department of Ecology. 2023. 6PPD Alternatives Assessment Hazard Criteria. Nos. 23-04–036. https://apps.ecology.wa.gov/publications/documents/2304036.pdf. ). Although USEPA has not yet recommended aquatic life criteria for 6PPD-q, states and tribes may independently adopt the recommended protective levels as their regulatory standards at their discretion. As a result, where 6PPD-q is the identified cause of a biological impairment, states and authorized tribes can develop and then obtain USEPA approval for restoration plans or TMDLs that include numeric targets developed by translating their narrative aquatic life criteria. If USEPA develops aquatic life criteria for 6PPD-q at some future date, then states and tribes may adopt the recommended protective levels as their regulatory standards, or they may propose alternative values based on their own scientifically defensible methods after review and approval by USEPA.
Typically, a TMDL follows a sequence of assessments, as shown in Figure 5-9 ( USEPA 2002 [F6FA44IC] USEPA. 2002. Guidelines for Reviewing TMDLs under Existing Regulations Issued in 1992. https://www.epa.gov/sites/default/files/2015-10/documents/2002_06_04_tmdl_guidance_final52002.pdf. ). As described in Cormier and Suter ( Cormier and Suter 2008 [J4YBWALW] Cormier, Susan M., and Glenn W. Suter. 2008. “A Framework for Fully Integrating Environmental Assessment.” Environmental Management 42 (4): 543–56. https://doi.org/10.1007/s00267-008-9138-y. ) and adapted from USEPA ( USEPA 2002 [F6FA44IC] USEPA. 2002. Guidelines for Reviewing TMDLs under Existing Regulations Issued in 1992. https://www.epa.gov/sites/default/files/2015-10/documents/2002_06_04_tmdl_guidance_final52002.pdf. ), the “…corresponding components of the assessment and management framework are indicated in grey oblongs: condition assessment (listing process), causal assessment (problem/pollutant identification), risk assessment of effects from exposure (target analysis), source assessment, risk assessment of sources (linkage of sources and target), management assessment (allocation to sources), and outcome assessment (update next listing cycle)” ( Cormier and Suter 2008 [J4YBWALW] Cormier, Susan M., and Glenn W. Suter. 2008. “A Framework for Fully Integrating Environmental Assessment.” Environmental Management 42 (4): 543–56. https://doi.org/10.1007/s00267-008-9138-y. ). Although adverse effects to coho could be the driver that initiates a TMDL, 6PPD-q may not be the cause of the adverse effects based on a causal assessment. When a causal assessment identifies 6PPD-q as a probable contributing cause, the state or authorized tribe could consider doing a more in-depth risk assessment to inform CWA program implementation efforts. If a TMDL is developed and controls are implemented to reduce loads, an outcome assessment could be used to evaluate the performance of the controls. Maps are useful for each type of assessment to scope the extent and patterns of adverse effects, to develop evidence for and against 6PPD-q as a cause, to model and allocate loadings, to design mitigation strategies and placement, and to map progress in achieving environmental goals.
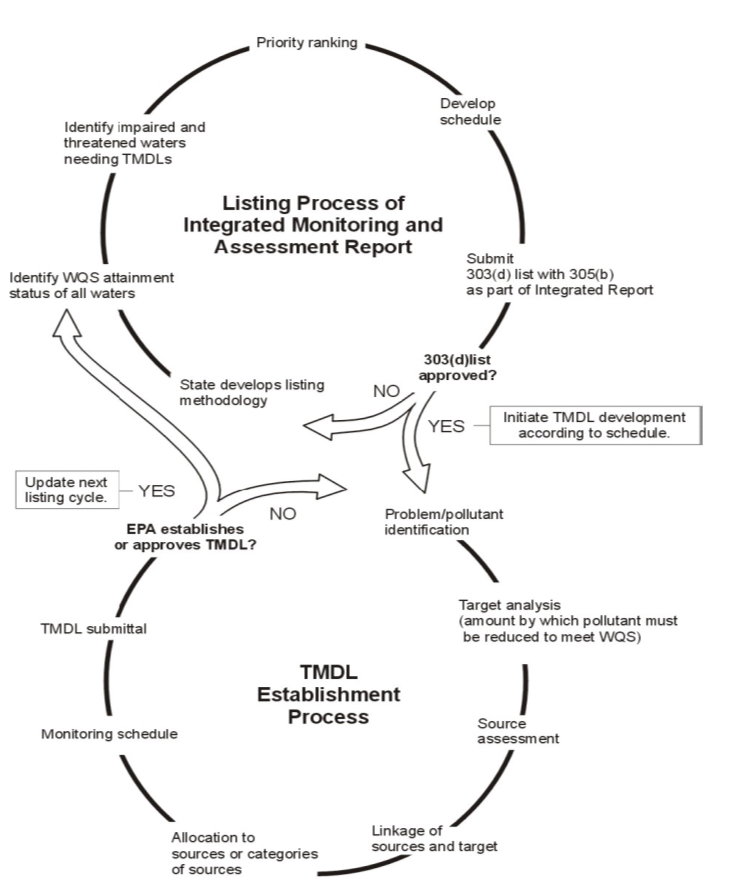
Figure 5-9. A diagram of the assessments and decisions involved in the listing of waters as impaired and the determination of total maximum daily loads. (WQS is water quality standards.)
Source: USEPA ( USEPA 2002 [F6FA44IC] USEPA. 2002. Guidelines for Reviewing TMDLs under Existing Regulations Issued in 1992. https://www.epa.gov/sites/default/files/2015-10/documents/2002_06_04_tmdl_guidance_final52002.pdf. )
TMDL reductions can be implemented through stormwater permits administered under the NPDES. According to USEPA ( USEPA 2015 [52GNBRV5] USEPA. 2015. “Stormwater Discharges from Transportation Sources.” Overviews and Factsheets. November 3. https://www.epa.gov/npdes/stormwater-discharges-transportation-sources. ), “[s]imilar to traditional stormwater management authorities (cities and counties), transportation authorities are also responsible for managing the stormwater runoff that discharges to our nation’s waters via regulated MS4s along streets, roads, and highways….” For example, if the adverse effect requiring remedy might impair coho survival and reproduction, the probable cause might be 6PPD-q from a combination of nonpoint-source road runoff and from point-source discharges regulated by NPDES stormwater permits. The TMDL would identify a maximum amount of the pollutant (for example, 6PPD-q) that can enter the stream and an allocation of those loads to point and nonpoint sources. These allocations can guide management options for mitigating identified sources.
Maps of stormwater distribution systems and outfalls can play an important role in TMDL management. For example, VELMA was demonstrated as capable of identifying 6PPD-q hotspots at fine scales (5 m), with results potentially useful when prioritizing the green infrastructure treatment placement, type, and amounts (at the watershed scale) that could be used to reduce URMS ( Halama et al. 2024 [5UMEQW95] Halama, Jonathan, Robert B. McKane, Bradley L. Barnhart, et al. 2024. “Watershed Analysis of Urban Stormwater Contaminant 6PPD-Quinone Hotspots and Stream Concentrations Using a Process-Based Ecohydrological Model.” Frontiers in Environmental Science 12 (March). https://doi.org/10.3389/fenvs.2024.1364673. Halama et al. 2022 [6Z5EW4N9] Halama, Jonathan, Robert McKane, Vivian Phan, et al. 2022. “VELMA Model Green Infrastructure Applications for Reducing 6PPD-Quinone Concentrations in Puget Sound Urban Stream.” EMCON 2021, March 25. https://www.ezview.wa.gov/Portals/_2001/Documents/Documents/HalamaMcKaneGISummitSalishSeaTalk25Mar2022_SWG30Mar2022_UpdateJJH.pdf. ). (For additional information on VELMA and its application to decision-making for environmental issues, visit: https://www.epa.gov/water-research/visualizing-ecosystem-land-management-assessments-velma-model).
The major transport and exposure of 6PPD-q to aquatic life is thought to be surface runoff and stormwater. Many other contaminants of concern are associated with transportation infrastructure and motor vehicles beyond 6PPD-q. Thus, the efforts to model stormwater and 6PPD-q have become entwined. Natural resource scientists and modelers recognized that existing runoff models developed for forestry practices and reducing sedimentation in rivers could be repurposed for stormwater modeling.
5.3.5.1.2 Groundwater Plume Modeling
Due to the limited amount of groundwater studies involving 6PPD and 6PPD-q, groundwater plume modeling has not been extensively examined.
5.3.5.2 Air Transport Modeling
TRWP transport by air is poorly understood and may represent an underestimated mechanism and source. TRWPs not only shed onto roadways but are dispersed in the air and deposited at distances from the roadways along a gradient that depends on the size and shape of the TRWP (see Figure 1-7 for a conceptual depiction of these phenomena). Numerous studies show particles greater than 10 µm at distances downwind of a roadway relevant for exposures to humans and biota. Airborne transport pathways should remain a concern until more research is available to verify its contribution to the environment.
Modeling of fine (PM2.5) and coarse (PM10) with estimates of TRWP allocations is a useful tool for predicting and comparing mass loading to the environment. Existing USEPA tools are useful resources for dispersion modeling methods using MOVES and AERMOD to estimate vehicle emissions and transport, including TRWP. State agencies often have higher-resolution information to support surrogates developed from state vehicle miles traveled data (see, for example, ( Washington State Department of Ecology 2023 [3NJSEXIP] Washington State Department of Ecology. 2023. 6PPD Alternatives Assessment Hazard Criteria. Nos. 23-04–036. https://apps.ecology.wa.gov/publications/SummaryPages/2304036.html. ).
Transportation data sets, as discussed in Section 5.3.2 and Section 5.3.4, are another data source to consider when modeling impacted areas. Many traffic GIS data layers rely on the Federal Highway Administration’s Highway Performance Monitoring System and the Freight Analysis Framework (FAF5), as well as local traffic monitoring systems managed by county and state agencies. High-resolution modeling efforts will help identify priority areas with greater tire emissions loads that can be cross-referenced with impervious surface within each watershed or basin.
5.3.5.2.1 Vapor
Significant knowledge gaps exist concerning contaminants associated with TRWP that may be present in the gas phase ( Johannessen et al. 2022 [RYBDCBV4] Johannessen, Cassandra, Amandeep Saini, Xianming Zhang, and Tom Harner. 2022. “Air Monitoring of Tire-Derived Chemicals in Global Megacities Using Passive Samplers.” Environmental Pollution 314 (December): 120206. https://doi.org/10.1016/j.envpol.2022.120206. ). Current data indicate that 6PPD and 6PPD-q are unlikely to volatilize at typical conditions in the natural environment (Section 3.4; Washington State Department of Ecology, 2022).
5.3.5.2.2 Deposition
The airborne fraction of TRWP reported in the literature ranges from 0.1% to 30% ( Grigoratos and Martini 2014 [RA3SMLZL] Grigoratos, Theodoros, and Giorgio Martini. 2014. Non-Exhaust Traffic Related Emissions. Brake and Tyre Wear PM. EUR 26648 EN. European Commission Joint Research Centre Institute of Energy and Transport. Grigoratos and Martini 2015 [M7P4CR2U] Grigoratos, Theodoros, and Giorgio Martini. 2015. “Brake Wear Particle Emissions: A Review.” Environmental Science and Pollution Research 22 (4): 2491–504. https://doi.org/10.1007/s11356-014-3696-8. Kole et al. 2017 [NZZMY6WC] Kole, Pieter Jan, Ansje J. Löhr, Frank G. A. J. Van Belleghem, and Ad M. J. Ragas. 2017. “Wear and Tear of Tyres: A Stealthy Source of Microplastics in the Environment.” International Journal of Environmental Research and Public Health 14 (10): 1265. https://doi.org/10.3390/ijerph14101265. ). The fate of airborne TRWP strongly depends on particle size and shape. Larger TRWP (that is, TRWP with an average diameter greater than 10 μm) are likely to settle on or near the roadway ( Kole et al. 2017 [NZZMY6WC] Kole, Pieter Jan, Ansje J. Löhr, Frank G. A. J. Van Belleghem, and Ad M. J. Ragas. 2017. “Wear and Tear of Tyres: A Stealthy Source of Microplastics in the Environment.” International Journal of Environmental Research and Public Health 14 (10): 1265. https://doi.org/10.3390/ijerph14101265. ). By comparison, TRWP with an average diameter less than 10 μm) are likely to remain airborne for minutes to hours and can be transported from hundreds of meters to 50 km from the source depending on particle characteristics and local conditions ( Kole et al. 2017 [NZZMY6WC] Kole, Pieter Jan, Ansje J. Löhr, Frank G. A. J. Van Belleghem, and Ad M. J. Ragas. 2017. “Wear and Tear of Tyres: A Stealthy Source of Microplastics in the Environment.” International Journal of Environmental Research and Public Health 14 (10): 1265. https://doi.org/10.3390/ijerph14101265. ). Kole et al. ( Kole et al. 2017 [NZZMY6WC] Kole, Pieter Jan, Ansje J. Löhr, Frank G. A. J. Van Belleghem, and Ad M. J. Ragas. 2017. “Wear and Tear of Tyres: A Stealthy Source of Microplastics in the Environment.” International Journal of Environmental Research and Public Health 14 (10): 1265. https://doi.org/10.3390/ijerph14101265. ) further state that “[s]pecific transport data on the 0.1–1 µm fraction are lacking, but it is well known that PM2.5 particles (i.e., particles less than 2.5 µm) can stay in the air for days or weeks and travel more than a thousand kilometers.”
As described in Section 4.4.2, concentrations of 6PPD and 6PPD-q are greater in road dust closer to roadways, and concentrations of 6PPD and 6PPD-q were higher in finer particles relative to coarser particles in road dust. More studies are needed to understand the distribution of 6PPD and 6PPD-q concentrations across particle sizes, including ultrafine (PM0.1), fine (PM2.5), and coarse (PM10) fractions. More research is also needed to understand how the sizes and characteristics of air-transported particles impact the occurrence, concentration, and transport of 6PPD-q in the environment. Section 8.2 describes data gaps and research needs pertaining to Occurrence, Fate, Transport, and Exposure to 6PPD and 6PPD-q in more detail.
5.3.5.3 Modeling 6PPD-q Stormwater Transport to Surface Water
Contaminant hotspot maps help identify locations for source control and prioritize green stormwater infrastructure treatments (i.e., rain gardens, bioswales, pervious pavements) that can most effectively reduce contaminant loadings to threatened aquatic habitats. Models that help identify such hotspots can be a useful tool when planning this load reduction. (For more information on SCMs and BMPs/green stormwater infrastructure, see Section 6.3).
The USEPA’s VELMA tool provides high-resolution spatial and temporal analysis of 6PPD-q hotspots and is a tool for prioritizing the locations, amounts, and types of green infrastructure that can most effectively reduce 6PPD-q stream concentrations to levels protective of coho salmon and other aquatic species ( Halama et al. 2024 [5UMEQW95] Halama, Jonathan, Robert B. McKane, Bradley L. Barnhart, et al. 2024. “Watershed Analysis of Urban Stormwater Contaminant 6PPD-Quinone Hotspots and Stream Concentrations Using a Process-Based Ecohydrological Model.” Frontiers in Environmental Science 12 (March). https://doi.org/10.3389/fenvs.2024.1364673. ). Figure 5-10 presents the modeling components used in VELMA to simulate 6PPD-q fate and transport in the Longfellow Creek watershed ( Halama et al. 2024 [5UMEQW95] Halama, Jonathan, Robert B. McKane, Bradley L. Barnhart, et al. 2024. “Watershed Analysis of Urban Stormwater Contaminant 6PPD-Quinone Hotspots and Stream Concentrations Using a Process-Based Ecohydrological Model.” Frontiers in Environmental Science 12 (March). https://doi.org/10.3389/fenvs.2024.1364673. ).

Figure 5-10. Example of how Visualizing Ecosystem Land Management Assessments (VELMA) modeling components can be used to simulate watershed-wide fate and transport of 6PPD-q.
Source: J. Halama et al. ( Halama et al. 2024 [5UMEQW95] Halama, Jonathan, Robert B. McKane, Bradley L. Barnhart, et al. 2024. “Watershed Analysis of Urban Stormwater Contaminant 6PPD-Quinone Hotspots and Stream Concentrations Using a Process-Based Ecohydrological Model.” Frontiers in Environmental Science 12 (March). https://doi.org/10.3389/fenvs.2024.1364673. ).

